No More Secrets: Logging Made Easy Through Graylog Part 7
Logging is a important but often overlooked part of an organization’s security posture. Logging without organization, searchability, or reporting leads to data being missed. This a continuation of a longer series that VDA Labs is writing on Graylog. This is part 7 of a multi-part series covering a variety of topics, including the following items:
- Installation, securing, and optimizing the setup part 1
- Installation, securing, and optimizing the setup part 2
- Domain Controller/DHCP log collection and alerts
- File/print server log collection and alerts
- Exchange server log collection
- IIS log collection
- Firewall log collection
- Setting up Threat Intelligence
- SQL Server
This week focuses on gathering logs from from Firewalls. These logs can help track and monitor users and greatly enhance troubleshooting and incident response event due to the correlation that can be completed.
Note: PFSense is being used this guide. Some steps or logs may be different depending on what firewall is being used. On Fortigates create a RAW input instead of using Syslog format.
Prerequisites
Creating our Syslog input(s)
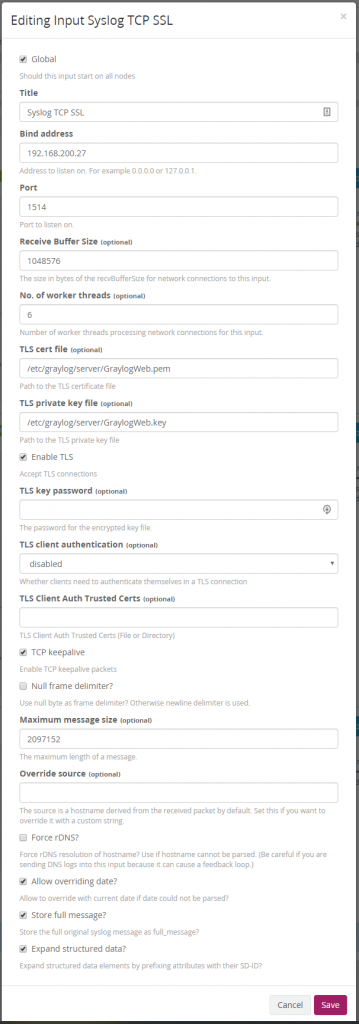
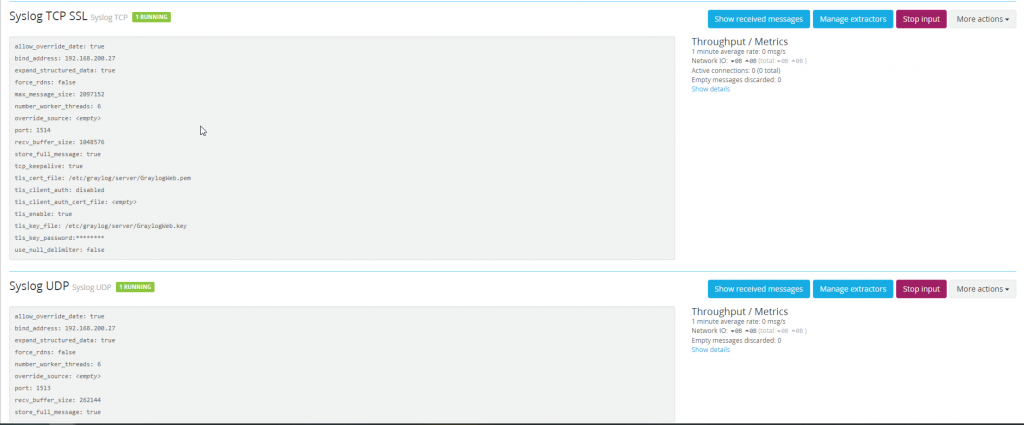
Start by browsing to System -> Inputs and creating a new Syslog TCP Input. Set the port to whatever you want, although extra work will need to be done to set the port to a low port. For this reason VDA sets their port to 1514 for Syslog TCP SSL inputs.
The same process needs to be completed for Syslog UDP inputs. VDA will be using port 1513 for Syslog UDP inputs.
Configuring The Firewall
For this example PFSense is being used which does not have a native TCP Syslog component. Without this TLS not be able to be used secure our logs. Other firewalls manufactures offer TCP and TLS logging this as a native service and as such will have a slightly different configuration.
Enabling Remote Logging
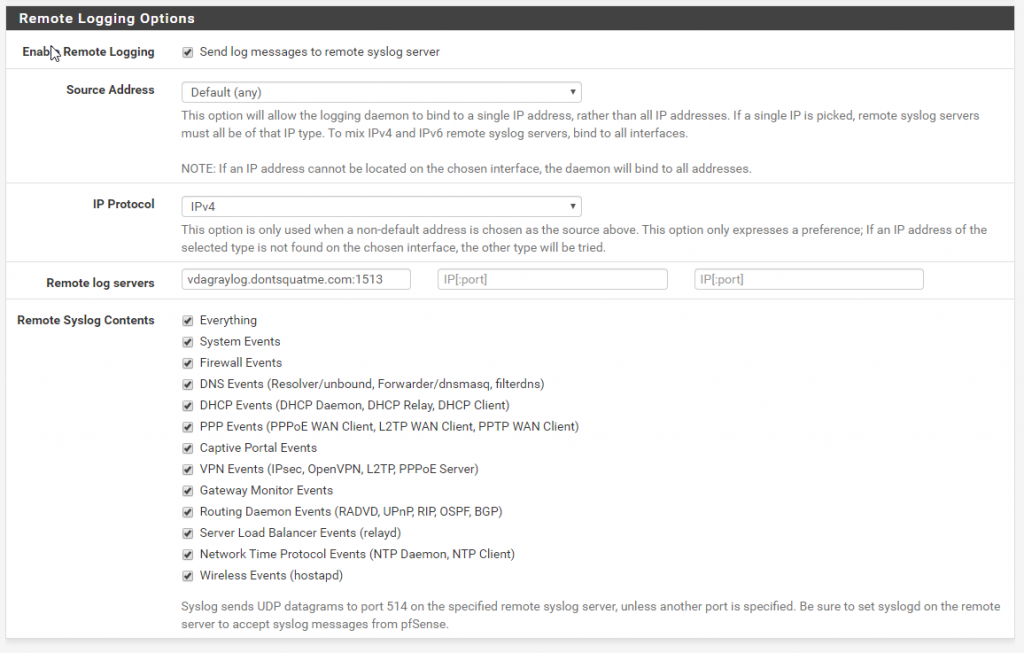
To configure remote logging on PFSense browse to Status > System Logs > Settings. Browse to the remote logging options and input the FQDN or IP of the Graylog server that you created.
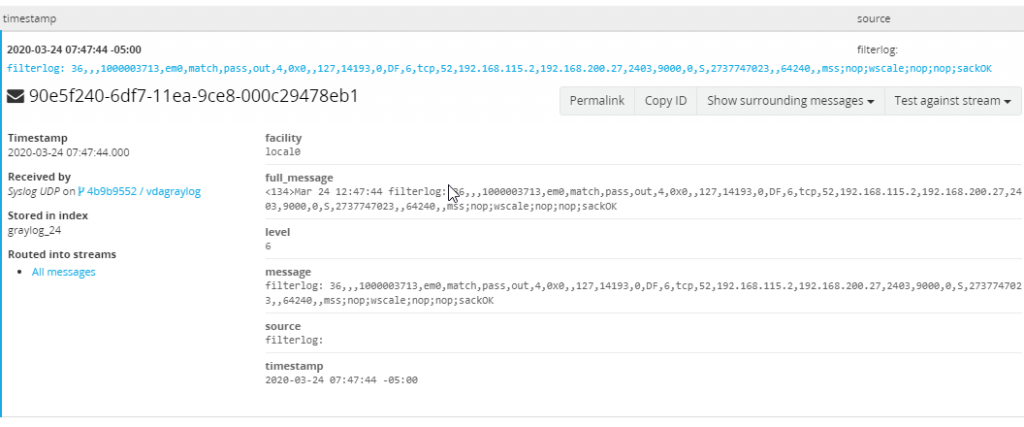
After being configured logs from PFSense should be visible in Graylog. The data incoming presents a problem though, it is completely unorganized. To fix this we can use a “Extractor” of which Graylog has marketplace of.
Making our Data Searchable
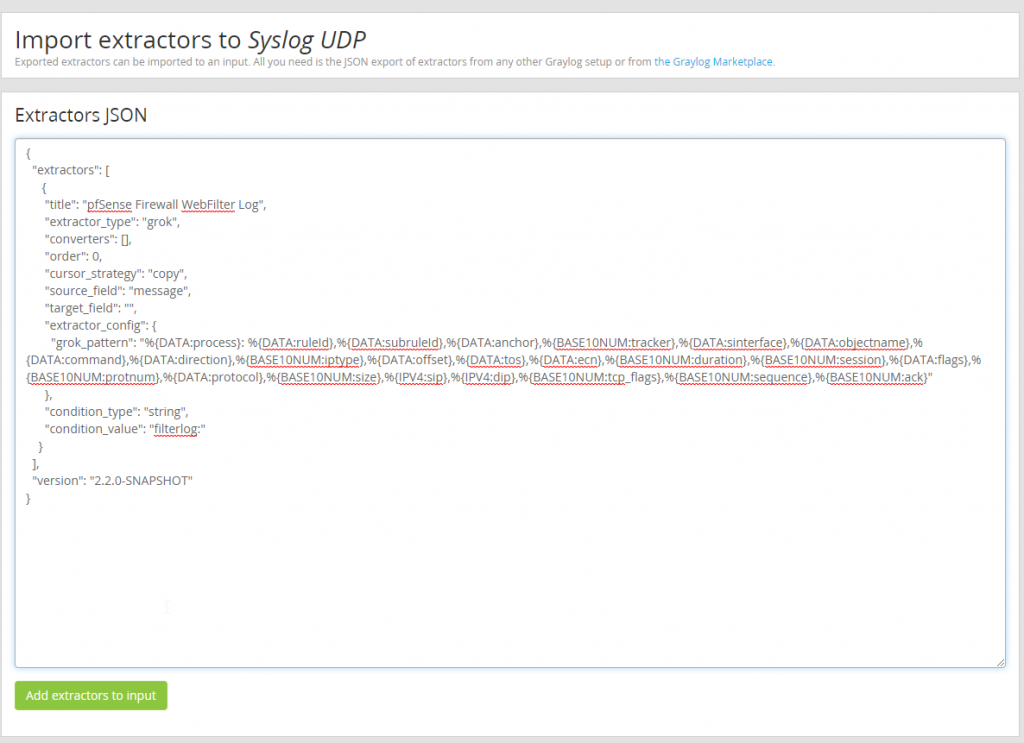
To start cleaning up the data incoming to our Graylog server lets use the following extractor. Browse GRAYLOG_pfSense_Extractors.json and copy the data contained within. Moving back to our Graylog server browse to System > Inputs > Manage extractors for “Syslog UDP” and select “Import Extractors”.
Using the extractor .json data we copied from the Graylog Marketplace paste that data into the “Extractors JSON” and add the extrator to the input.
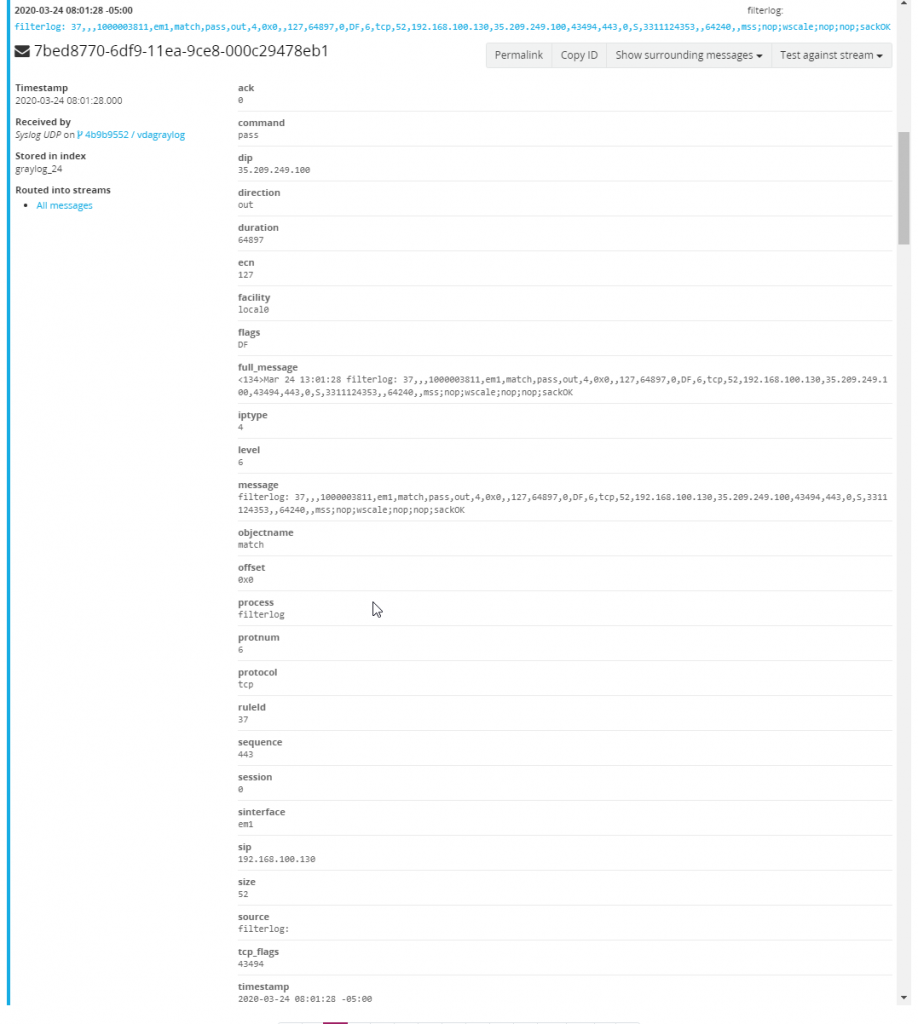
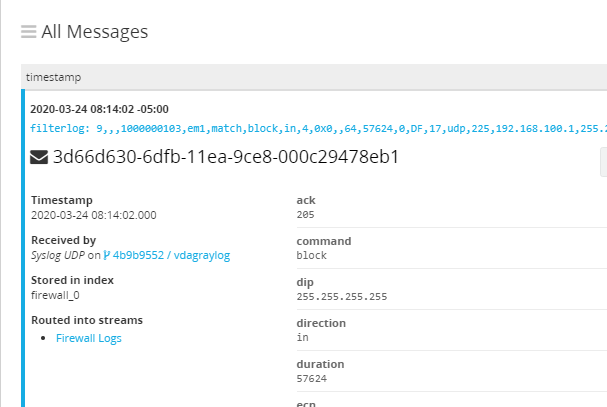
With the extractor imported a new extractor named “pfSense Firewall WebFilter Log” should now exist on the Graylog Syslog UDP input. When browsing back to look at new incoming firewall messages all fields should now be parsed and searchable.
Organizing our Data
With PFSense logs incoming and being parsed, it is important to create a new index for Firewall logs so that rotation and retention rules can be created for firewall logs.
Creating a New Index
Browse to System > Indices and create a new index set named Firewall Logs with a index name of firewall.
Routing Logs Into the Firewall Index
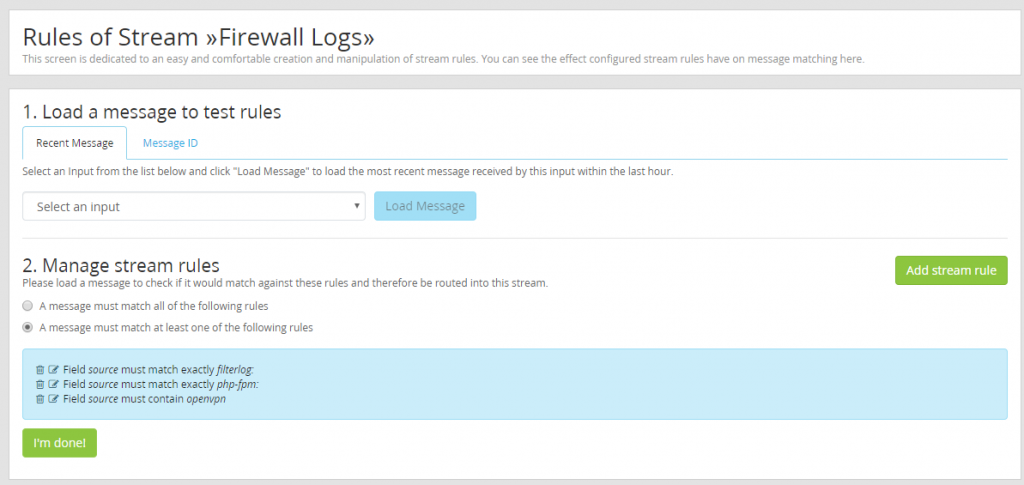
With the index created all that is left is to a filter to route firewall logs into the new firewall index. For PFSense use the source of “filterlog:” or “php-form:” and “openvpn”.
With filtering configured logs are now being set to the firewall index.
Creating Alerts
With data incoming data from the firewalls can be used to help teams be proactive against threats.
Failed VPN Logons
When working to pen test organizations VDA frequently uses VPN forms to test and brute force credentials. By alerting for failed VPN logons security teams and administrators can get ahead of an attacker before they gain a foothold within a organizations network.
Create a New Notification
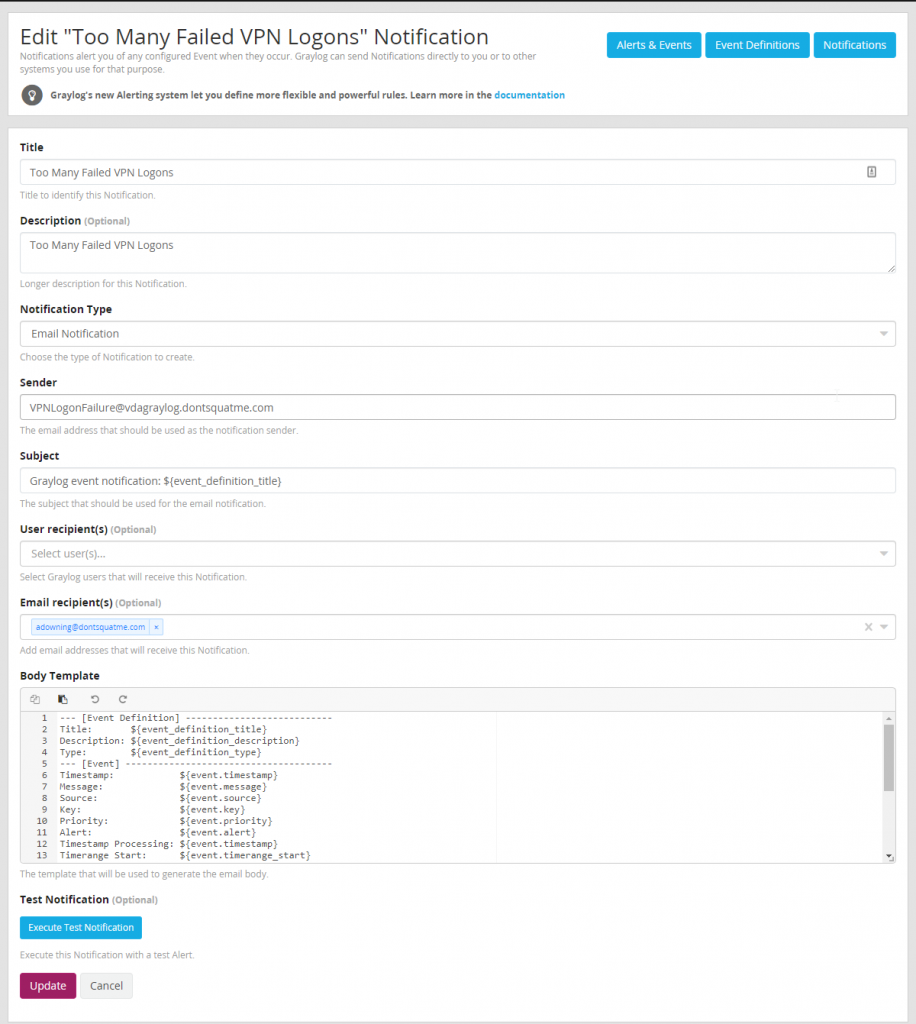
Before creating an alert, first a event must be defined to define what action happens when an alert is generated. To do this browse to Alerts > Notifications and create a new notification.
Create a New Event/Alert
With email notifications that can be sent to the NOC and SOC for investigation configured a event can can be to call our notification and generate a email to pertinent staff. Due to the severity of a compromised VPN account it is important that staff respond quickly to any attacks against VPN endpoints.
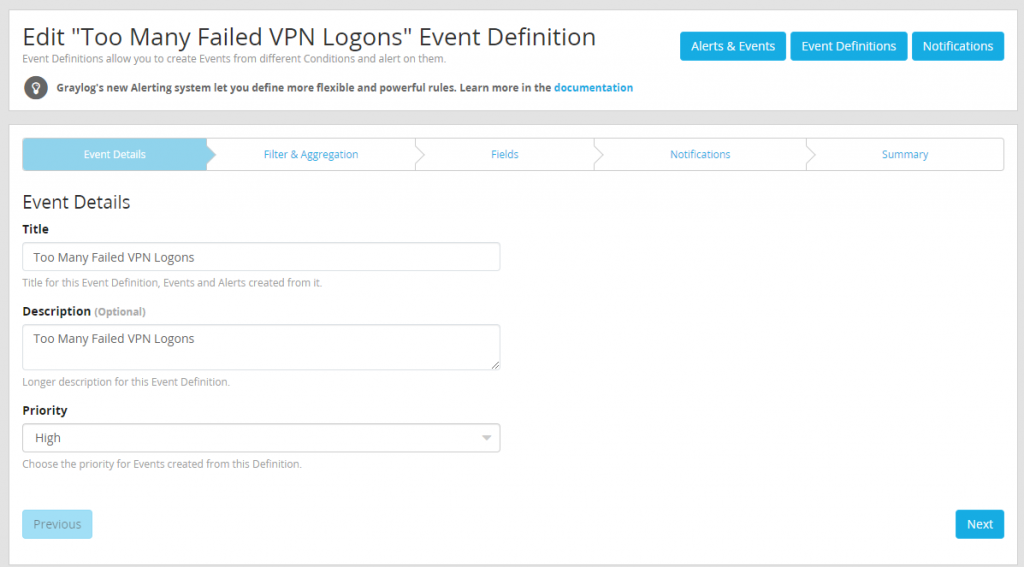
To start create a new event definition and name it appropriately and set priority to high.
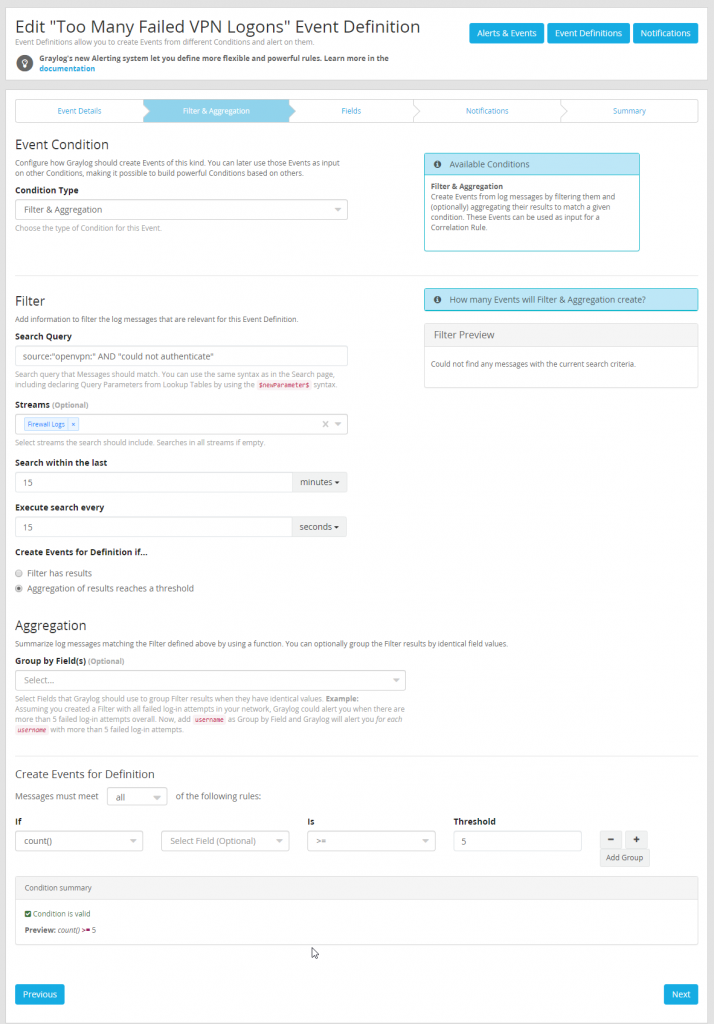
After naming the event the meat of the alert configuration must be built. This alert will be a “Filter & Aggregation” condition and for PFSense use the following search query (source:”openvpn:” AND “could not authenticate”). This search query will need to be customized depending on the firewall or VPN appliance being used. Make sure to only search the firewall logs stream as this will help reduce the load the search causes when it is run.
Organizations will want to define what the thresholds are considered acceptable for failed VPN logons especially when an organization has many remote workers as failed logons are just a part of life. For the purpose of this test we will have defined very low thresh holds to make testing easier.
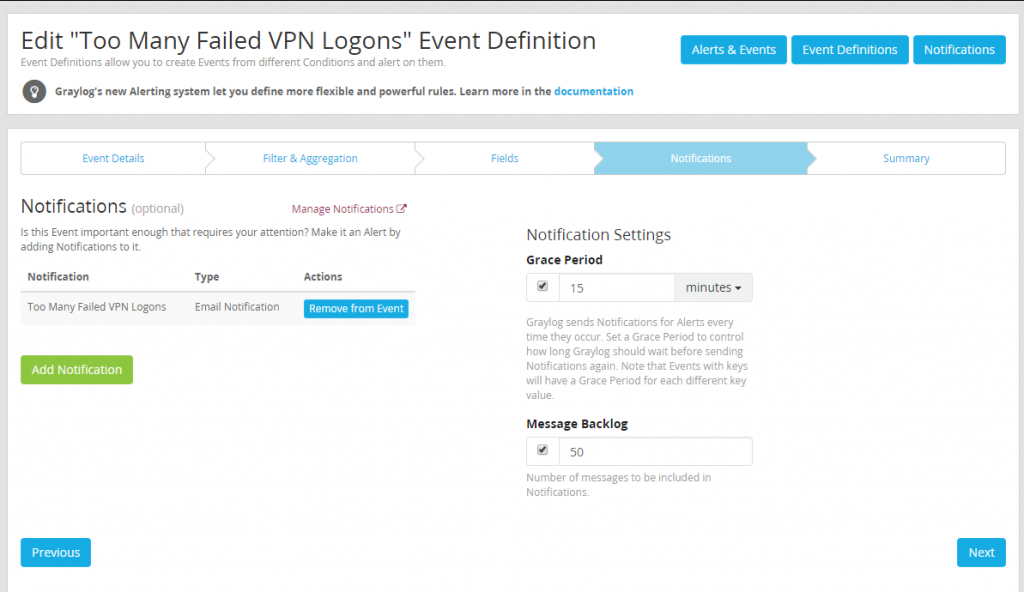
Since no custom fields are being defined, the next step can be skipped. Move directly to defining the notification to be used when the alert triggers using the notification just created during previous steps.
With the alert configured testing can commence to let us confirm the alert works. If everything is working as intended after the threshold set is met, a email will be generated and sent to pertinent staff for investigation.
After completing all the steps described in part 7 of the VDA Graylog setup guide administrators and security teams should be able to create alerts and dashboards along with being able to troubleshoot firewall issues using the logs being sent to Graylog.
Stay tuned for part 8 of VDA’s blog series on Graylog where we will be covering adding Alien Vault Open Source Threat Intelligence to our firewall logs to help enhance our logs and give further insight into the traffic being generated on a organizations network.

