


Logging is a important but often overlooked part of an organization’s security posture. Logging without organization, searchability, or reporting leads to data being missed. This a continuation of a longer series that VDA Labs is writing on Graylog. This is part 4 of a multi-part series covering a variety of topics, including the following items:
- Installation, securing, and optimizing the setup part 1
- Installation, securing, and optimizing the setup part 2
- Domain Controller/DHCP log collection and alerts
- File/print server log collection and alerts
- Exchange server log collection
- IIS log collection
- Firewall log collection
- Setting up Threat Intelligence
- SQL Server
This week focuses on gathering logs from from a Windows File and Print server. These logs can help track and monitor users and greatly enhance troubleshooting and incident response event due to the correlation that can be completed.
Note: The file server being used is Windows Server 2019. Some steps or logs may be different depending on the version of Windows Server you are using.
Prerequisites
File and Print Server Logging
File Server File Auditing
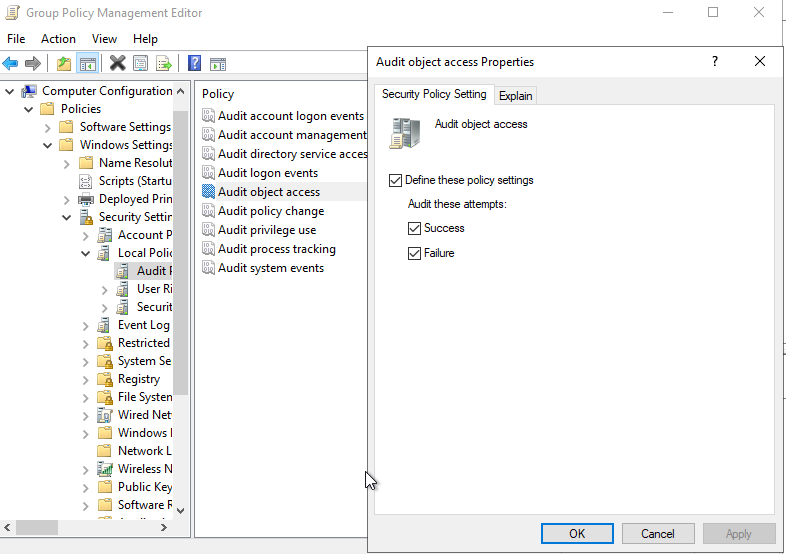
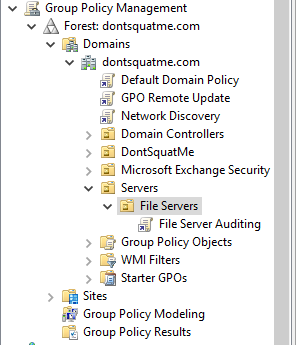
Start by creating a a new GPO object named “File Server Auditing”. Inside of this policy enable “Audit Object Access” for both success and failures. These GPO options can be found under Computer Configuration -> Windows Settings -> Security Settngs -> Audit Policies -> Audit object access.
Apply the GPO that was created in last step to the file servers.
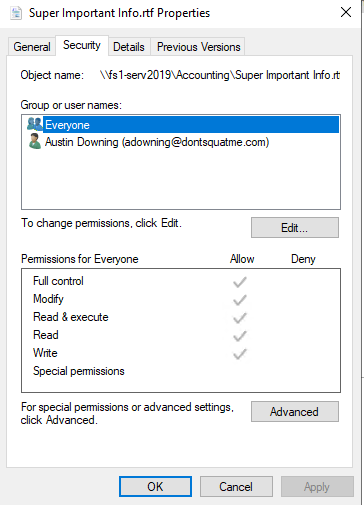
Now it is time to configuring our audit settings for our shares. To do this browse the local folder location on the file server and open the security setting for the folder we want to modify. Open the auditing tab from under advanced security settings.
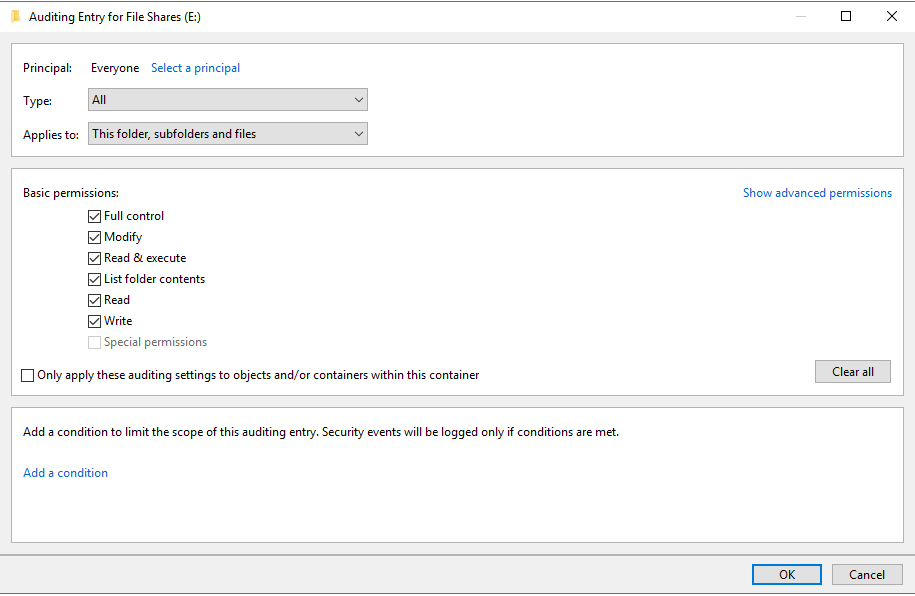
Add a new entry for the “Everyone” group and select all permissions and all types of access, recursively apply these permissions so all files and folders are modified.
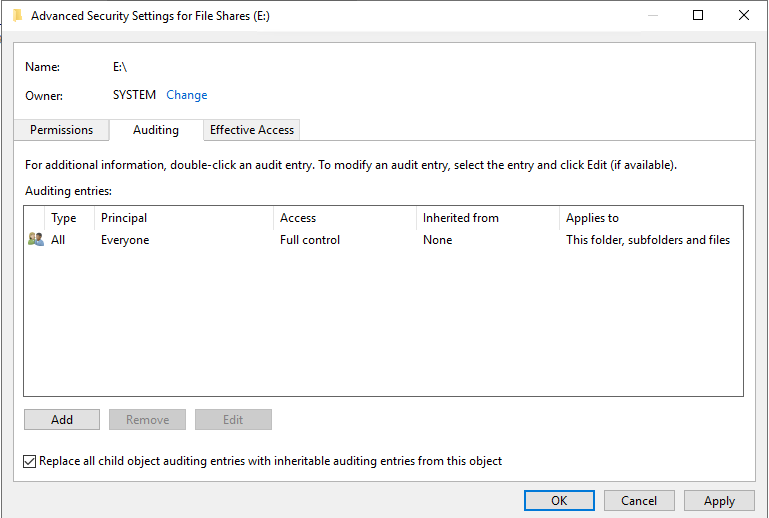
Looking at the settings, the everyone audit policy has been added to the folder security.
Print Server Auditing
Installing our Log Shipping Agent
To ship our logs from our systems, we will be using NXlog Community Edition. This is a tool which can be configured to read just about any file or system input. There is also an enterprise support option available if required by your organization.
We will be using the Windows .MSI install for this guide. We will also need the GraylogWeb.pem and GraylogWeb.key we generated in part 2 of this series and our graylogca.pem we created in part one.
Installation
Installing NXLog is as simple as running through our download .msi installer. After installation is finished, we will need to write our configuration.
File Server Configuration
The first step of this configuration is to copy the GraylogWeb.pem, GraylogWeb.key, and graylogca.pem to C:\Program Files(x86)\nxlog\certs. Without these files, we will not be able to enable our SSL connect to the Graylog input we created in the last step. With those files moved over, let’s start going over the configuration we need to create. Here is the complete configuration file, located in C:\Program Files(x86)\nxlog\conf\nxlog.conf:
## This is a sample configuration file. See the nxlog reference manual about the
## configuration options. It should be installed locally and is also available
## online at http://nxlog.org/docs/

## Please set the ROOT to the folder your nxlog was installed into,
## otherwise it will not start.

#define ROOT C:\Program Files\nxlog
define ROOT C:\Program Files (x86)\nxlog

Moduledir %ROOT%\modules
CacheDir %ROOT%\data
Pidfile %ROOT%\data\nxlog.pid
SpoolDir %ROOT%\data
LogFile %ROOT%\data\nxlog.log

<Extension gelf>
Module xm_gelf
ShortMessageLength 500
</Extension>

<Input EventLog_In>
# Use 'im_mseventlog' for Windows XP, 2000 and 2003
Module im_msvistalog
# Uncomment the following to collect specific event logs only
Query <QueryList>\
<Query Id="0">\
<Select Path="Application">*</Select>\
<Select Path="System">*</Select>\
<Select Path="Security">*</Select>\
</Query>\
</QueryList>
</Input>
<Output EventLog_Out>
Module om_ssl
OutputType GELF_TCP
Host <FQDN>
CertFile C:\Program Files (x86)\nxlog\cert\GraylogWeb.pem
CertKeyFile C:\Program Files (x86)\nxlog\cert\GraylogWeb.key
CAFile C:\Program Files (x86)\nxlog\cert\graylogca.pem
Port 12201
</Output>
<Route EventLog>
Path EventLog_In => EventLog_Out
</Route>
Print Server Configuration
## This is a sample configuration file. See the nxlog reference manual about the
## configuration options. It should be installed locally and is also available
## online at http://nxlog.org/docs/

## Please set the ROOT to the folder your nxlog was installed into,
## otherwise it will not start.

#define ROOT C:\Program Files\nxlog
define ROOT C:\Program Files (x86)\nxlog

Moduledir %ROOT%\modules
CacheDir %ROOT%\data
Pidfile %ROOT%\data\nxlog.pid
SpoolDir %ROOT%\data
LogFile %ROOT%\data\nxlog.log

<Extension gelf>
Module xm_gelf
ShortMessageLength 500
</Extension>

<Input EventLog_In>
# Use 'im_mseventlog' for Windows XP, 2000 and 2003
Module im_msvistalog
# Uncomment the following to collect specific event logs only
Query <QueryList>\
<Query Id="0">\
<Select Path="Application">*</Select>\
<Select Path="System">*</Select>\
<Select Path="Security">*</Select>\
</Query>\
</QueryList>
</Input>

<Output EventLog_Out>
Module om_ssl
OutputType GELF_TCP
Host vdagraylog.dontsquatme.com
CertFile C:\Program Files (x86)\nxlog\cert\GraylogWeb.pem
CertKeyFile C:\Program Files (x86)\nxlog\cert\GraylogWeb.key
CAFile C:\Program Files (x86)\nxlog\cert\graylogca.pem
Port 12201
</Output>

<Input PrintLog_In>
# Use 'im_mseventlog' for Windows XP, 2000 and 2003
Module im_msvistalog
# Uncomment the following to collect specific event logs only
Query <QueryList>\
<Query Id="0">\
<Select Path="Microsoft-Windows-PrintService/Operational">*</Select>\
</Query>\
</QueryList>
</Input>

<Output PrintLog_Out>
Module om_ssl
OutputType GELF_TCP
Host vdagraylog.dontsquatme.com
CertFile C:\Program Files (x86)\nxlog\cert\GraylogWeb.pem
CertKeyFile C:\Program Files (x86)\nxlog\cert\GraylogWeb.key
CAFile C:\Program Files (x86)\nxlog\cert\graylogca.pem
Port 12201
</Output>

<Route EventLog>
Path EventLog_In => EventLog_Out
</Route>

<Route PrintLog>
Path PrintLog_In => PrintLog_Out
</Route>
Organizing our Data
Creating File Server and Print Indexes
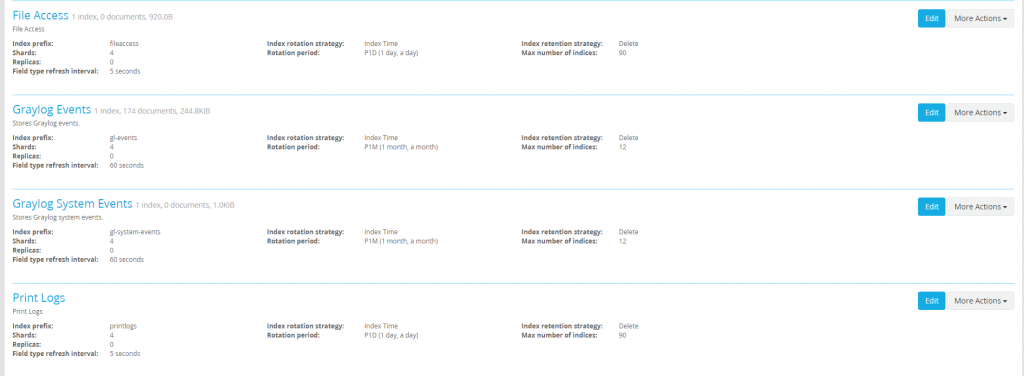
Browsing to the Graylog server, our file and print server logs are now coming in. Before doing anything lets create two new indexes one for our file access logs and one for our print logs. For more detailed instructions on how to create our index
Creating Our File Access Stream
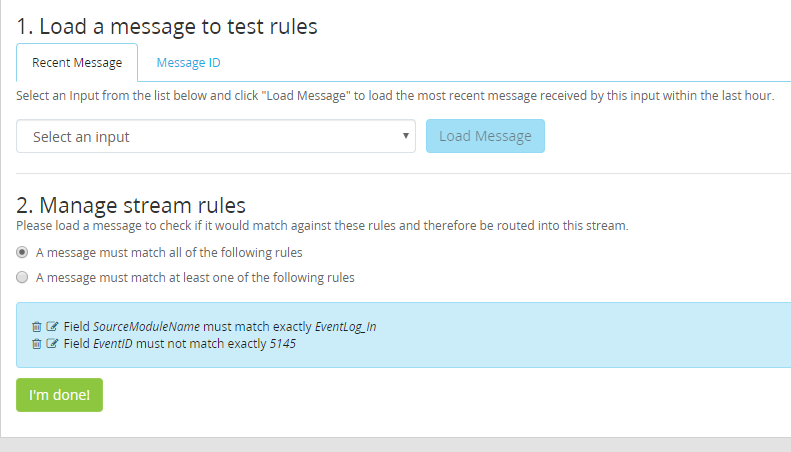
With the indexes created, rules need to be created before we so that messages are routed into the proper indexes. Start by modifying the generic “Event Logs” stream. We want to ensure that file access logs are not accidentally included in our general event logs. For a more detailed look at how to create stream rules please see part 3 of our blog.
Now that our file share logs are excluded from the primary event log stream, the file share logs will need to be routed into their new index we created. The regular expression used ensures that only logs from our file servers are added to our File Access Logs. This regular expression can be left out if a administrator wants to route all file operations in an organization into the File Access Logs instead of just file servers. The regular expression will be updated to match the naming scheme of a organizations file servers.
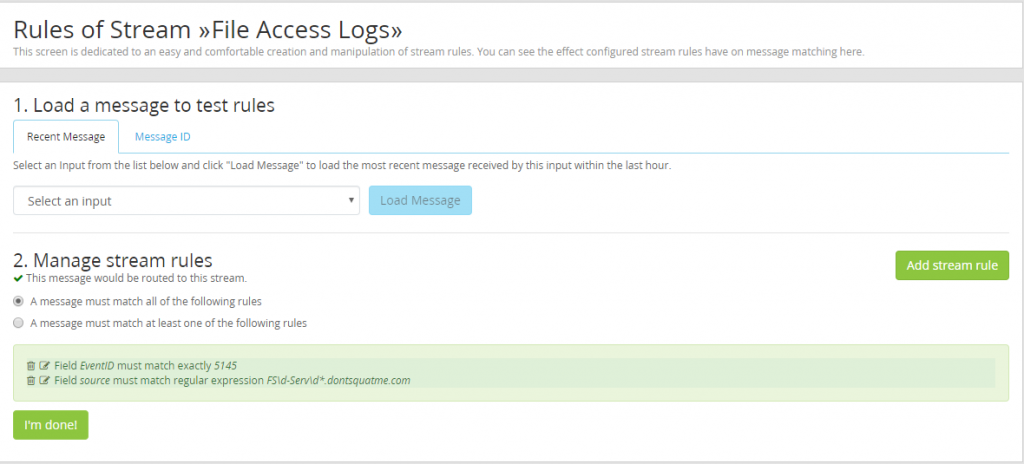
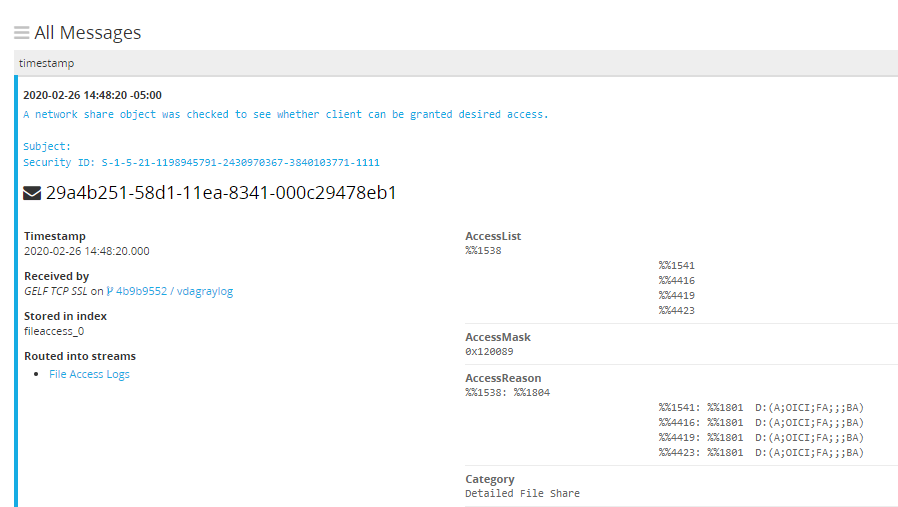
If everything worked file access logs from our file servers should be appearing in our “File Access” index.
Configuring Our Print Server Stream
To route our new print logs into the print stream created earlier add a rule that keys in on the SourceModuleName “PrintLog_In” created in the NXLog configuration applied earlier. For a more detailed look at how to create stream rules please see part 3 of our blog.
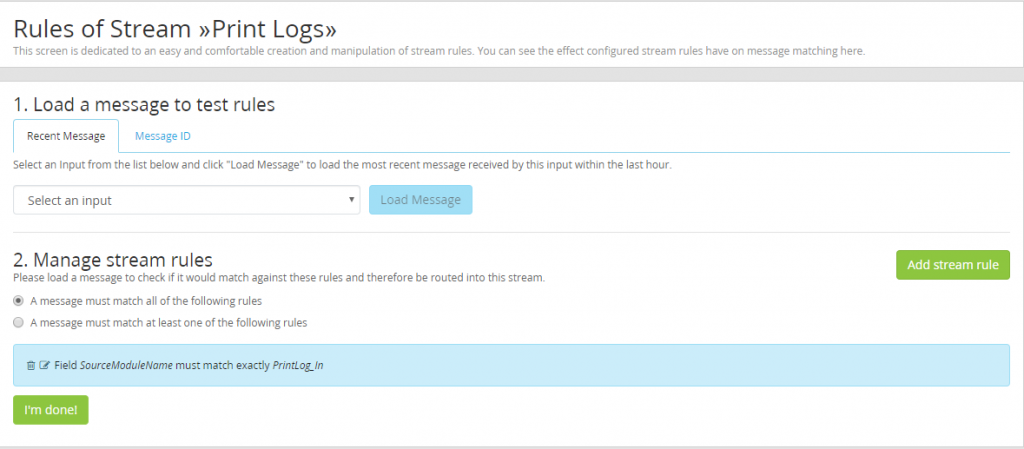
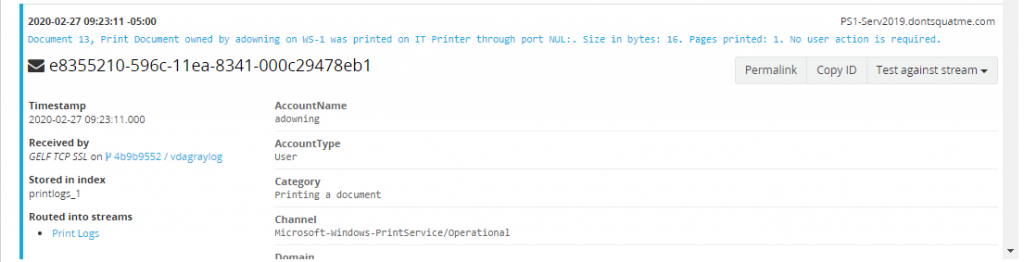
With the rules configured, the next logs to come in from the print server will now be routed into the index printlogs_*.
Creating Alerts and Dashboards from Our Data
With data coming into the “File Access” and “Print Logs” indexes created, it is time to start using incoming data to create alerts and dashboards to help teams be more proactive in solving issues.
Creating a Dashboard for Total Number of Open Files and Deleted Files
One way a SOC or administration team might discovery issues in the environment being monitored is by looking at the average number of files being opened or deleted. Deviation from normal averages should be a cause for concern and should start a process to discover why the deviation is occurring.
Start by creating a new search for the following teams AccessList: *%%4416* OR AccessList: *%%1537*. Make sure to limit the search to our file access logs index so that less processing power is consumed. For more information on the various access list values see the documentation created by Microsoft.
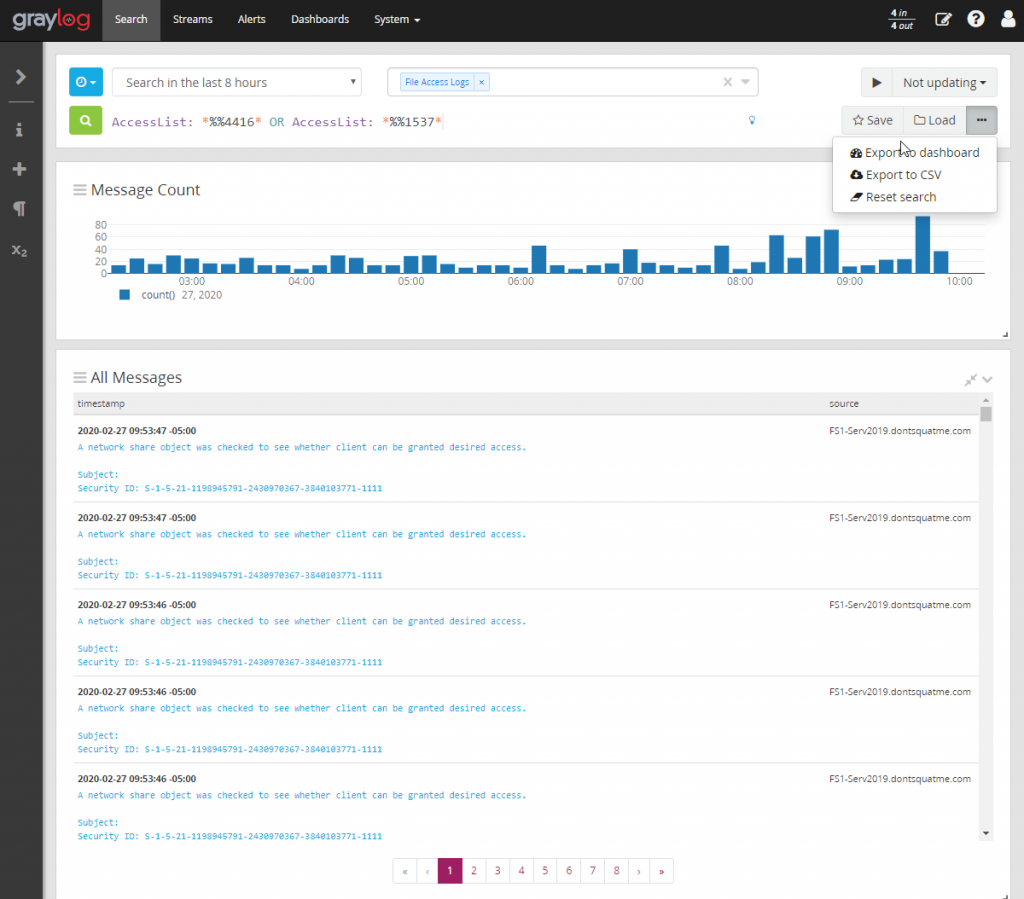
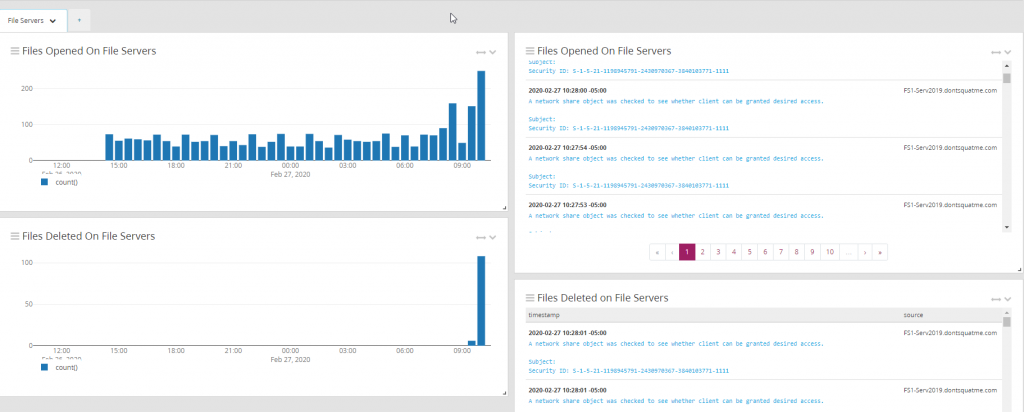
Browse the the new dashboard that was created and edit the first two widget that exist. Remove the search term AccessList: *%%1537* as these two widget will be dedicated to showing how many files have been opened in a organization over the course of day.
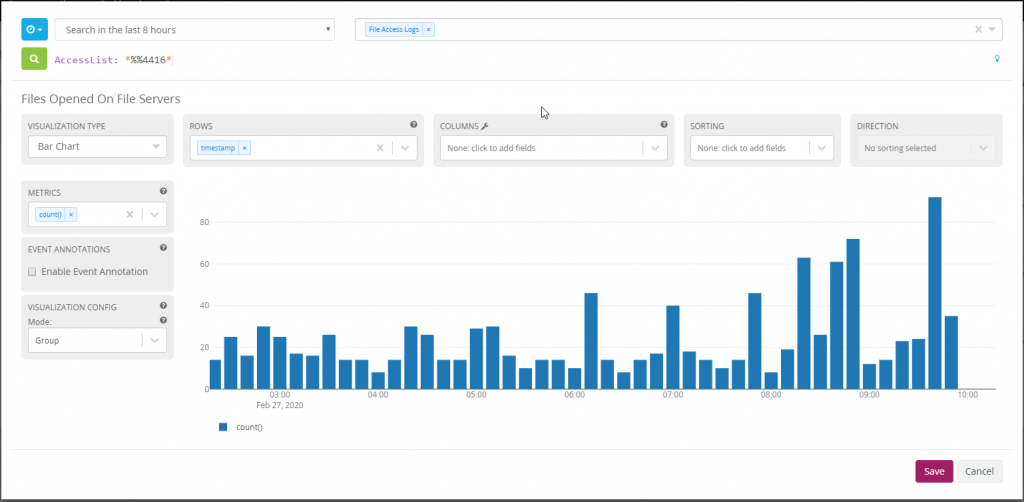
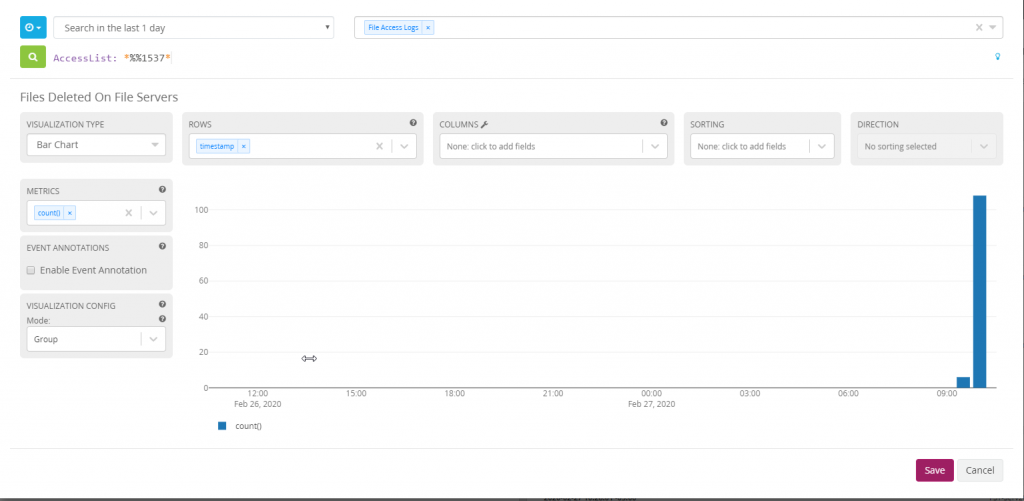
Heading back to the File Server dashboard, expand the menus on the left of the screen and select “Create”. Create a aggregation chart and a message table. Label both of these “Files Deleted on File Servers”.
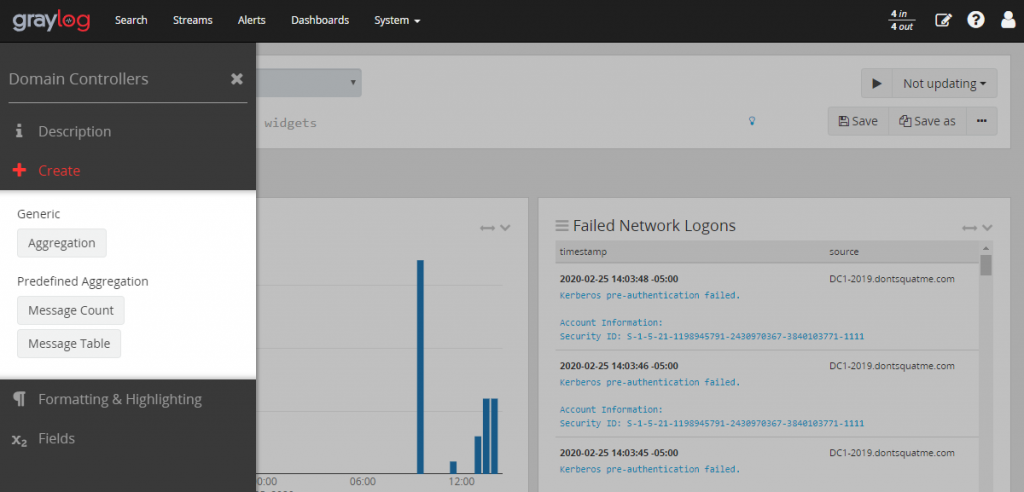
Edit the new aggregation chart using the search term AccessList: *%%1537*. This will allow a team to see how many files have been deleted throughout the day.
Complete the same process for the file deletion message table. After completion the dashboard should look similar to the image below.
Create Alert of Excessive Number Of File Being Deleted
A abnormally large numbers of files being deleted at once can be a sign of problems on a network. By creating alerts based on what is considered normal NOC and administrative teams can get ahead of ransomware that may break out or a rogue employee destroying data.
Creating our Notification
Start by browsing to the Alerts page in Graylog. Continue browsing to notifications and start creating a new notification.
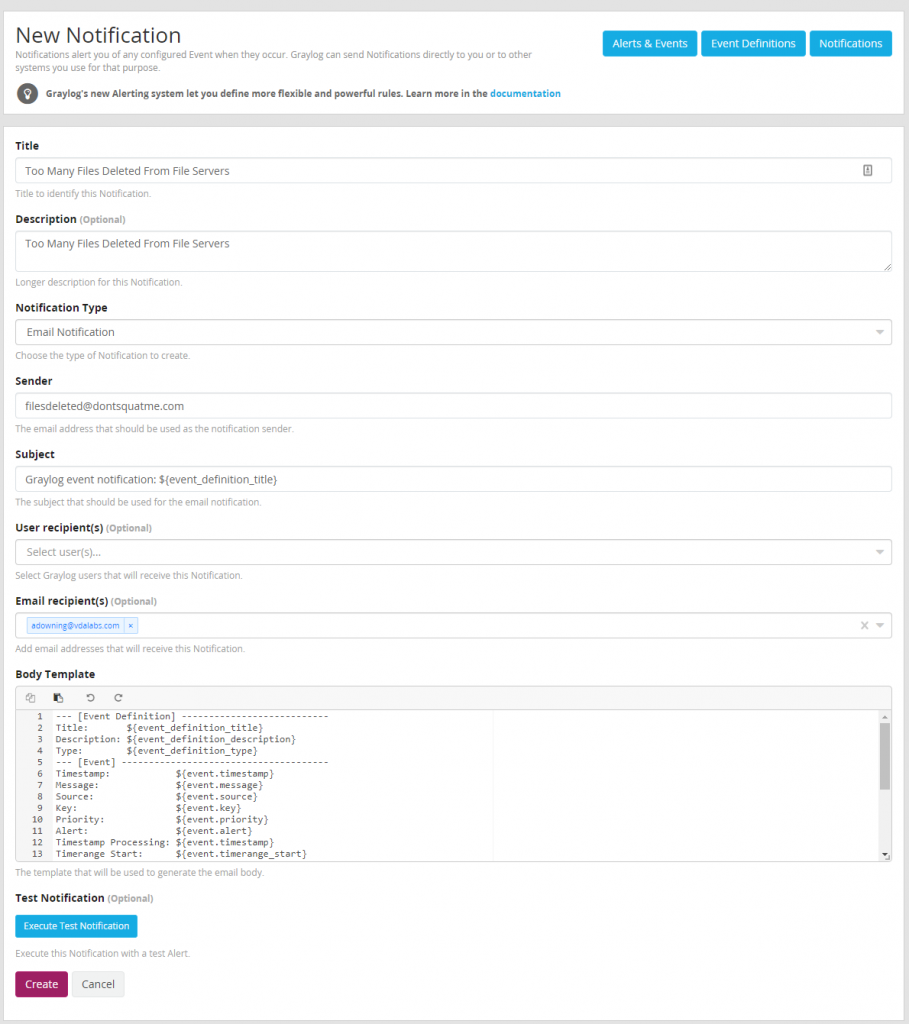
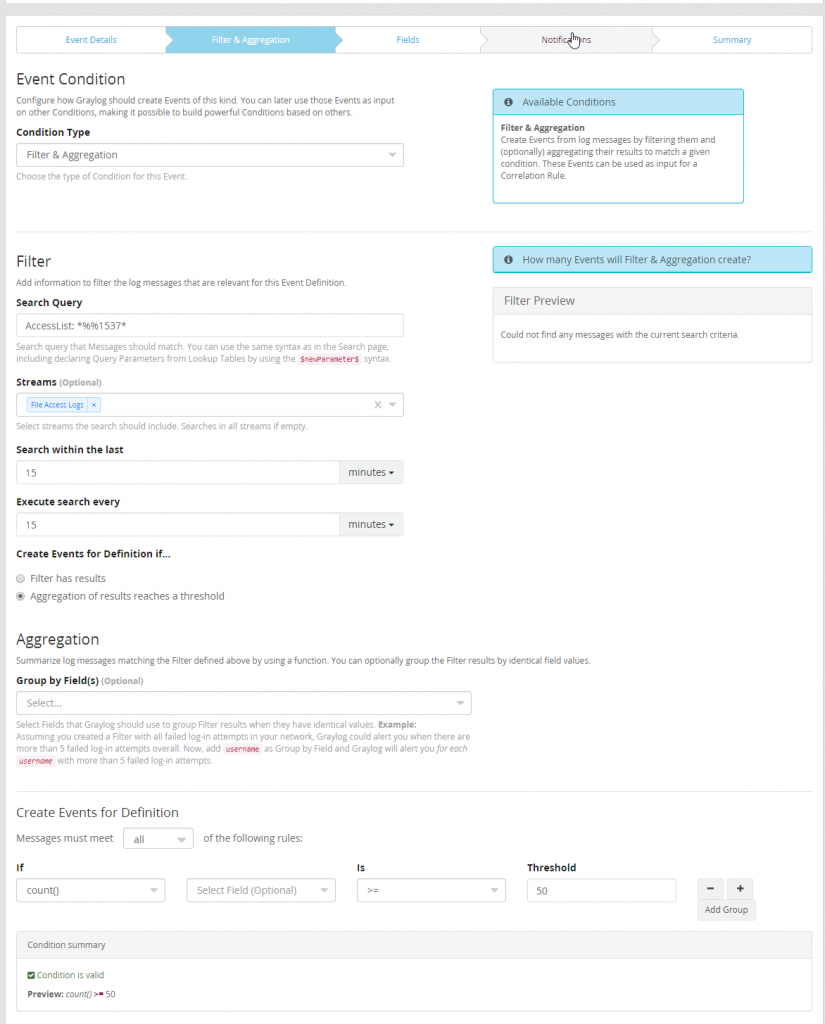
With the notification created a new event needs to be defined. Start by opening the Event Definitions page inside of the Alerts page. Start creating a new event. This event will be titled “Too Many Files Deleted From File Servers”.

Create a Filter & Aggregation condition. Search AccessList: *%1537* and ensure only logs from the File Access Logs streams are being evaluated.
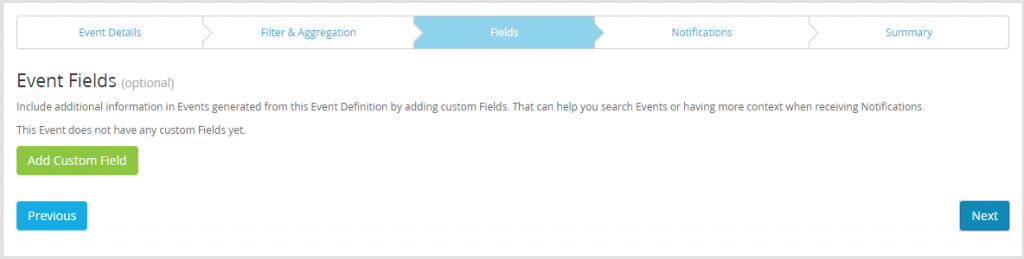
No custom fields are being created so the “Fields” tab can be ignored.
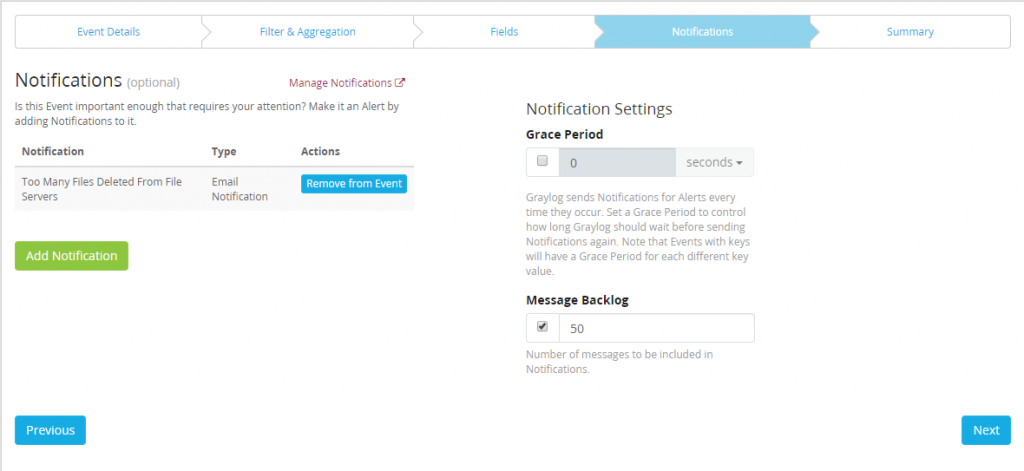
Attach the “Too Many Files Deleted From File Servers” notification created earlier and define how many messages you would like to be sent with alerts.
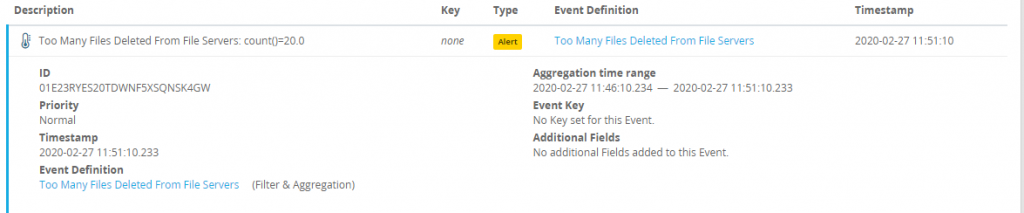
If everything was successful there should be alerts appearing if a number of files greater than our configured threshold.
With that we have configured alerts and dashboards for file servers and print servers.
-
Next Post
BurpSuite Pro Extensions: Some Favorites
Related Posts

4 Benefits of SIEM Software
Why SIEM Software is Essential for Your Business At VDA Labs, we pride ourselves on…

MSSP Services for Your Organization?
In today’s digital age, businesses face increasing threats from cyberattacks, data breaches, and other security…

How SIEM Helps Safeguard Your Business
VDA Vigilance SIEM Solution stands at the forefront of cybersecurity, offering unparalleled services in monitoring,…

4 Security Breaches SIEM Can Help Mitigate
Security Information and Event Management (SIEM) is a crucial component in the modern cybersecurity arsenal.…

What Is SIEM Software and How Does It Work?
Overview of Security Information and Event Management (SIEM) When it comes to information security, one…

Citrix ADC (Netscaler ADC) Multi-Factor Bypass
While working with a client, VDA engineers encountered an interesting circumstance that allowed for the…