


Logging is a important but often overlooked part of an organization’s security posture. Logging without organization, searchability, or reporting leads to data being missed. This a continuation of a longer series that VDA Labs is writing on Graylog. This is part 3 of a multi-part series covering a variety of topics, including the following items:
- Installation, securing, and optimizing the setup part 1
- Installation, securing, and optimizing the setup part 2
- Domain Controller/DHCP log collection and alerts
- File/print server log collection and alerts
- Exchange server log collection
- IIS log collection
- Firewall log collection
- Setting up Threat Intelligence
- SQL Server
This week focuses on gathering logs from from a Windows Domain Controller/DHCP server. These logs are some of the most important logs a blue team can gather. They can help track and monitor users and devices across the organization and greatly enhance troubleshooting and incident response event due to the correlation that can be completed.
Prerequisites
Domain Controller and DHCP Logging
Before gathering logs from our systems, there are a few prerequisites to take care of. First, enable logging for the events the domain controllers will encounter such as password changes, account lock-outs, and login failures, etc. Enable DHCP logging in order to see a historical account of which IP address were handed out to clients. This will allow the sysadmin to trace activity through the firewall once log collection begins.
Enabling Domain Controller Logging
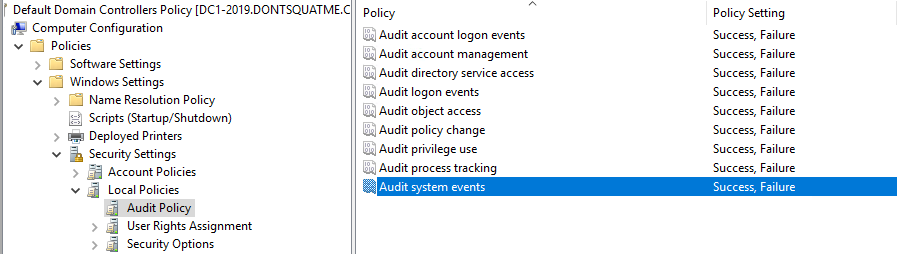
To enable logging on Domain Controllers, edit the “Default Domain Controller Policy” GPO. After opening the “Default Domain Controller Policy” GPO, browse to Computer Configuration -> Policies -> Windows Settings -> Security Settings -> Local Policies -> Audit Policies and enable Success and Failure tracking for all events.
Enabling DHCP Logging
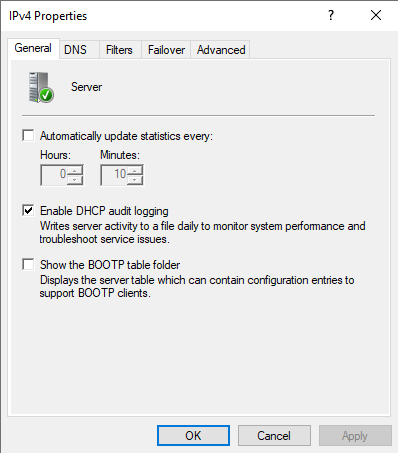
To enable DHCP logging, use the DHCP administration tool, right-click on the DHCP Server that needs modification, select properties, and then enable DHCP audit logging from the General tab. The log files created will be located in %systemroot%\system32\dhcp.
Creating Our First Graylog Inputs
Now that Windows is configured to create logs, configure Graylog to accept the logs from the services. To start this process, browse to System -> Inputs.
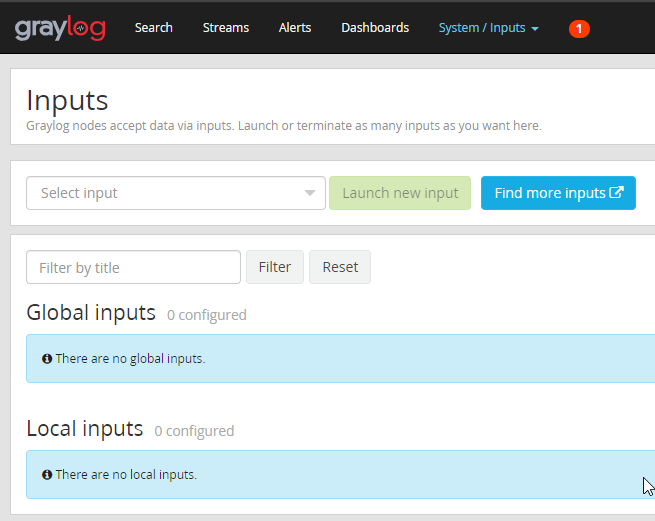
Our empty input section
From the “Select Input” drop down, select “GELF TCP” and launch that new input. Let’s go over the settings we need to configure.
1. Enable Global Input
1. This will ensure that, if we create a cluster of Graylog servers, this input is created on all of them.
2. Bind address
1. Set this to the IP address currently being used by the Graylog Server.
3. TLS cert file
1. Make sure this points at the GraylogWeb.pem we created
4. TLS private key file
1. Make sure this points at the GraylogWeb.key we created
Everything else can be left on the default settings. If the configuration is successful, there will be one running Global Input.
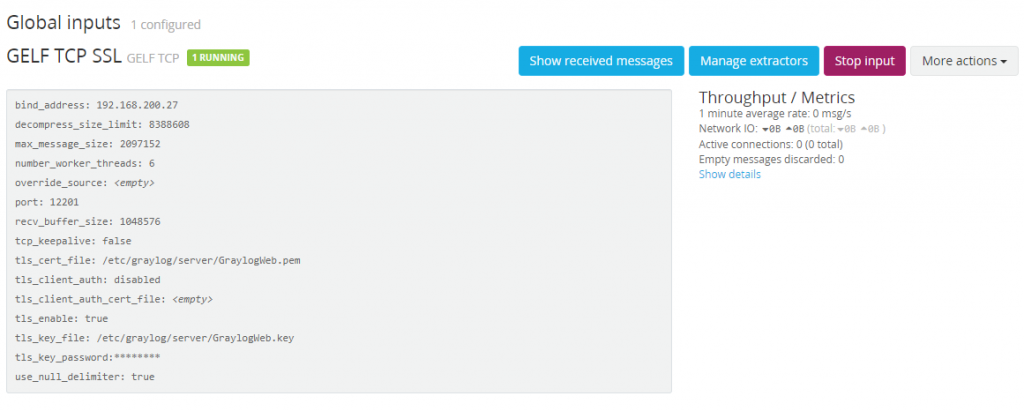
Our new SSL input waiting for logs
Next is configuring our Domain Controller to start shipping the DC logs to the Graylog server.
Installing our Log Shipping Agent
To ship the DC logs from our domain, lets use NXlog Community Edition. This is a tool which can be configured to read just about any file or system input. There is also an enterprise support option available if required by your organization.
The Windows .MSI install will be used for this guide. Both the GraylogWeb.pem and GraylogWeb.key from part 2 of this series and the graylogca.pem from part one will be needed.
Installation
Installing NXLog is as simple as running through our download .msi installer. After installation is finished, the configuration needs to be written.
Configuration
The first step of this configuration is to copy the GraylogWeb.pem, GraylogWeb.key, and graylogca.pem to C:\Program Files(x86)\nxlog\certs. Without these files, the SSL connection to the Graylog input that was created in the last step will fail. With those files moved over, let’s start going over the configuration we need to create. Here is the complete configuration file, located in C:\Program Files(x86)\nxlog\conf\nxlog.conf:
## This is a sample configuration file. See the nxlog reference manual about the
## configuration options. It should be installed locally and is also available
## online at http://nxlog.org/docs/

## Please set the ROOT to the folder your nxlog was installed into,
## otherwise it will not start.

#define ROOT C:\Program Files\nxlog
define ROOT C:\Program Files (x86)\nxlog

Moduledir %ROOT%\modules
CacheDir %ROOT%\data
Pidfile %ROOT%\data\nxlog.pid
SpoolDir %ROOT%\data
LogFile %ROOT%\data\nxlog.log

<Extension gelf>
Module xm_gelf
ShortMessageLength 500
</Extension>

<Extension ParseDHCP>
Module xm_csv
Fields $ID ,$Date ,$Time ,$Description ,$IPAddress ,$ReportedHostname ,$MACAddress ,$UserName ,$TransactionID ,$QResult ,$Probationtime ,$CorrelationID ,$Dhcid
Delimiter ','
</Extension>

<Input EventLog_In>
# Use 'im_mseventlog' for Windows XP, 2000 and 2003
Module im_msvistalog
# Uncomment the following to collect specific event logs only
Query <QueryList>\
<Query Id="0">\
<Select Path="Application">*</Select>\
<Select Path="System">*</Select>\
<Select Path="Security">*</Select>\
<Select Path="DNS Server">*</Select>\
<Select Path="Directory Service">*</Select>\
<Select Path="DFS Replication">*</Select>\
</Query>\
</QueryList>
</Input>

<Input DHCP_IN>
Module im_file
File "C:\\Windows\\Sysnative\\dhcp\\DhcpSrvLog-*.log"
SavePos TRUE
InputType LineBased
Exec $Message = $raw_event;
</Input>

<Output DHCP_Out>
Module om_ssl
OutputType GELF_TCP
Host <FQDN>
CertFile C:\Program Files (x86)\nxlog\cert\GraylogWeb.pem
CertKeyFile C:\Program Files (x86)\nxlog\cert\GraylogWeb.key
CAFile C:\Program Files (x86)\nxlog\cert\graylogca.pem
Port 12201
</Output>

<Output EventLog_Out>
Module om_ssl
OutputType GELF_TCP
Host <FQDN>
CertFile C:\Program Files (x86)\nxlog\cert\GraylogWeb.pem
CertKeyFile C:\Program Files (x86)\nxlog\cert\GraylogWeb.key
CAFile C:\Program Files (x86)\nxlog\cert\graylogca.pem
Port 12201
</Output>

<Route DHCP>
Path DHCP_IN => DHCP_OUT
</Route>

<Route EventLog>
Path EventLog_In => EventLog_Out
</Route>
Breaking Down The Configuration File
Important sections of this configuration file:
<Extension gelf>
Module xm_gelf
ShortMessageLength 500
</Extension>
Extending the “Short Message” field of the GELF message type from 64 characters to 500 characters can prevent some logs from creating errors.
<Extension ParseDHCP>
Module xm_csv
Fields $ID ,$Date ,$Time ,$Description ,$IPAddress ,$ReportedHostname ,$MACAddress ,$UserName ,$TransactionID ,$QResult ,$Probationtime ,$CorrelationID ,$Dhcid, $VendorClass(Hex), $VendorClass(ASCII), $UserClass(Hex), $UserClass(ASCII), $RelayAgentInformation, $DnsRegError
Delimiter ','
</Extension>
All the logs created by our DHCP server are comma separated values. Browsing to %systemroot%/System32/dhcp/, will show the log files created for each day of the week. Inside these files will be a listing for each field created. For each field in the DHCP log file, a corresponding field in the CSV parser is required.
<Input EventLog_In>
# Use 'im_mseventlog' for Windows XP, 2000 and 2003
Module im_msvistalog
# Uncomment the following to collect specific event logs only
Query <QueryList>\
<Query Id="0">\
<Select Path="Application">*</Select>\
<Select Path="System">*</Select>\
<Select Path="Security">*</Select>\
<Select Path="DNS Server">*</Select>\
<Select Path="Directory Service">*</Select>\
<Select Path="DFS Replication">*</Select>\
</Query>\
</QueryList>
</Input>
Next, lets select which event logs are worth gathering. Starting with Server 2016, NXLog can no longer absorb all the Windows logs (too many sources). Because of this issue, a few logs sources will be need to be picked that will have the highest impact on security and troubleshooting. To add new event log paths, append a new select path which points to the new event log. The limit is 256 sources.
<Input DHCP_IN>
Module im_file
File "C:\\Windows\\Sysnative\\dhcp\\DhcpSrvLog-*.log"
SavePos TRUE
InputType LineBased
Exec $Message = $raw_event;
</Input>
With the <Input DHCP_IN> section, NXLog is being told where to look for the DHCP logs and what the file name formatting should be.
<Output DHCP_Out>
Module om_ssl
OutputType GELF_TCP
Host <FQDN>
CertFile C:\Program Files (x86)\nxlog\cert\GraylogWeb.pem
CertKeyFile C:\Program Files (x86)\nxlog\cert\GraylogWeb.key
CAFile C:\Program Files (x86)\nxlog\cert\graylogca.pem
Port 12201
</Output>

<Output EventLog_Out>
Module om_ssl
OutputType GELF_TCP
Host <FQDN>
CertFile C:\Program Files (x86)\nxlog\cert\GraylogWeb.pem
CertKeyFile C:\Program Files (x86)\nxlog\cert\GraylogWeb.key
CAFile C:\Program Files (x86)\nxlog\cert\graylogca.pem
Port 12201
</Output>
The next two sections are dedicated to configuring where to send the logs. The system to needs to know how to use SSL key, cert, and CA that were created earlier and copied to C:\Program Files (x86)\nxlog\cert\.
<Route DHCP>
Path DHCP_IN => DHCP_OUT
</Route>

<Route EventLog>
Path EventLog_In => EventLog_Out
</Route>
In this last section, NXLog is notified where the outputs need to route the created inputs to. Lets go directly from EventLog_In and DHCP_IN to EventLog_Out and DHCP_OUT making for a very simple routing configuration.
With the configuration file and SSL certs copied over, restart the NXlog service and browse to C:\Program Files (x86)\nxlog\data\nxlog.log. The service should restart without errors.
Back to Graylog!
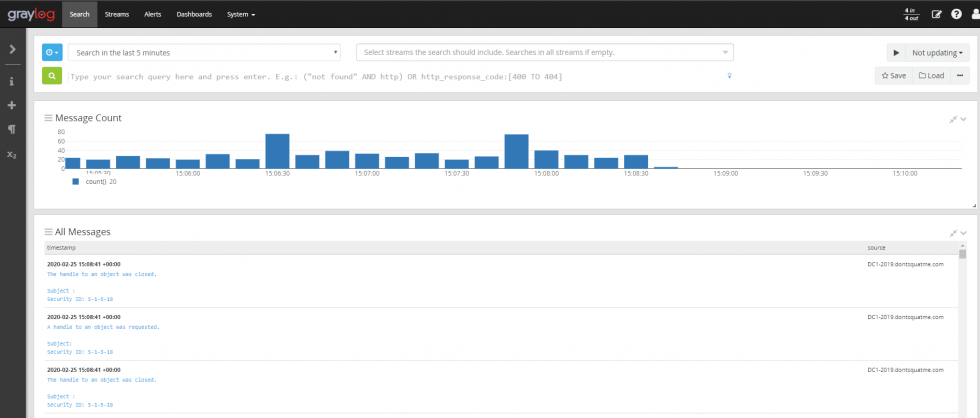
Browsing to the Graylog server, logs should be coming in. FINALLY! THE FRUITS OF OUR LABOR!
Organizing our Data
Creating our Indexes
Now that data is coming into Graylog lets start building and configuring a index to store our data. This data can be seen by browsing to “System / Indices” A index is group of data in Graylog that has a a common configuration for retention, sharding, and replication of the stored data. Typically I create a different index for various types of data. For example I would have a index for SQL logs, a index for Domain Controller Logs, a index for DHCP logs, etc. Before we do anything lets modify our default index set.
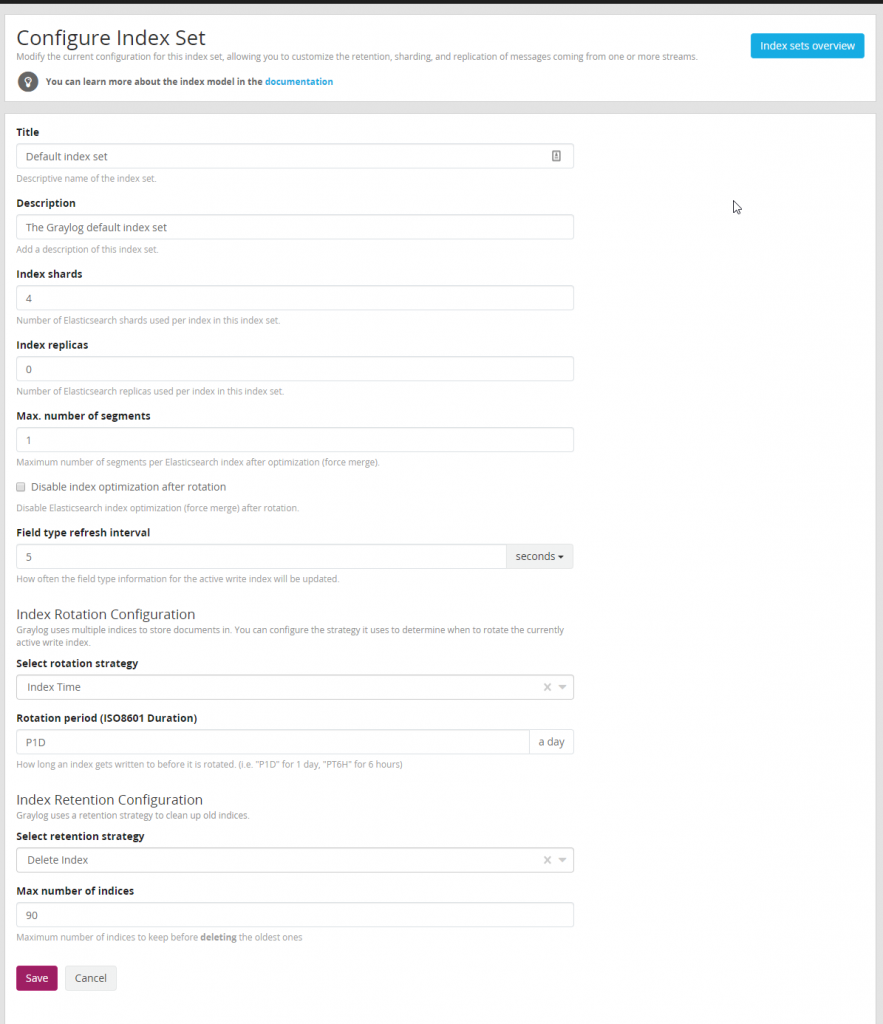
It is typical use a rotation period of P1D or 1 day. By using this retention period it is easy to calculate data set size for each type of index we create. For the default index I use 90 days but you may want to change this based on your organizations needs and how much storage you want to dedicate to logs. The number of shards and replicas can be left default unless a multi-node Graylog setup is being run.
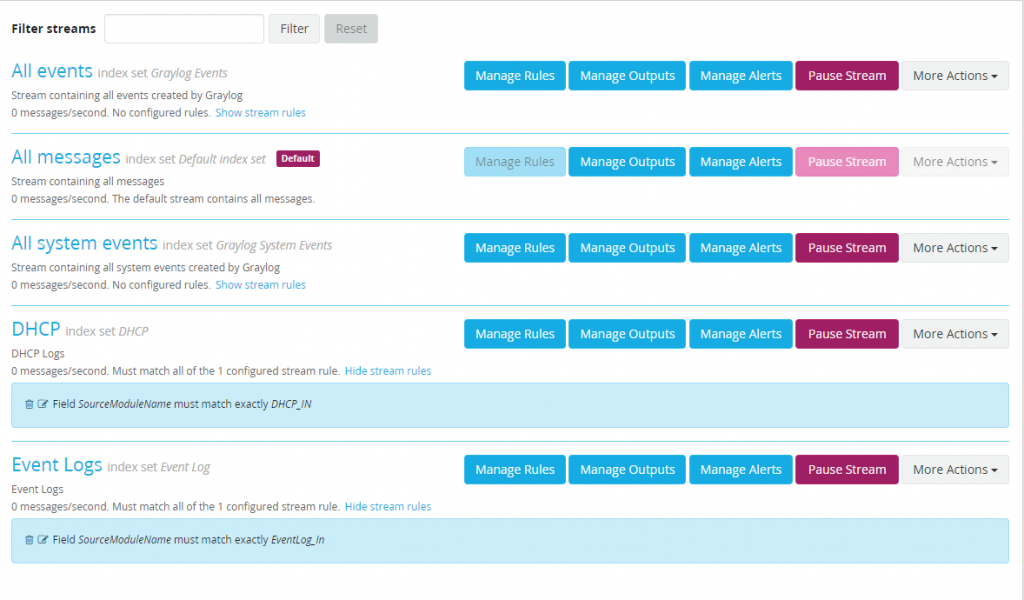
Next create two new indexes “DHCP” and “Event Log”. Feel free to name these index sets however the name will be used to label the index a log is in so it is useful to have descriptive names. Here is what it should look like when completed.
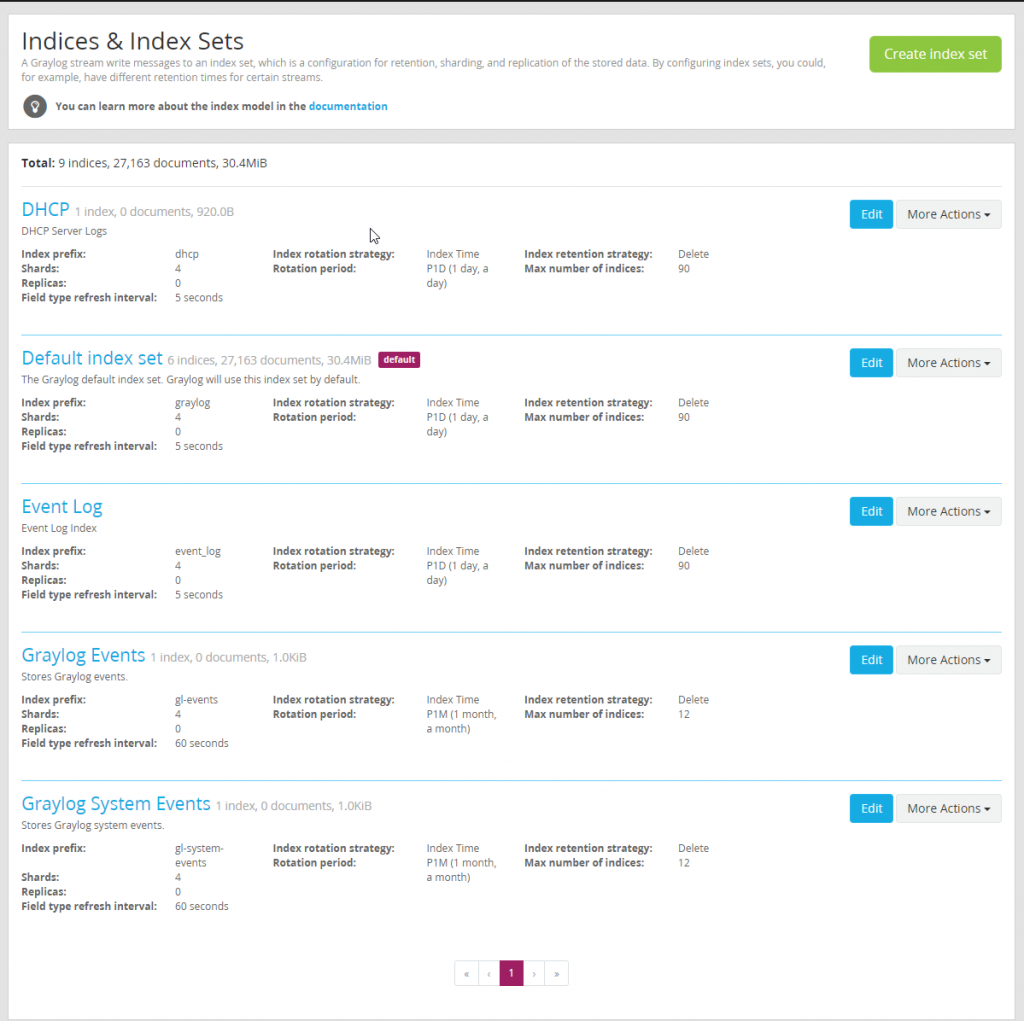
Our created indexes
Routing our Data Into our New Indexes
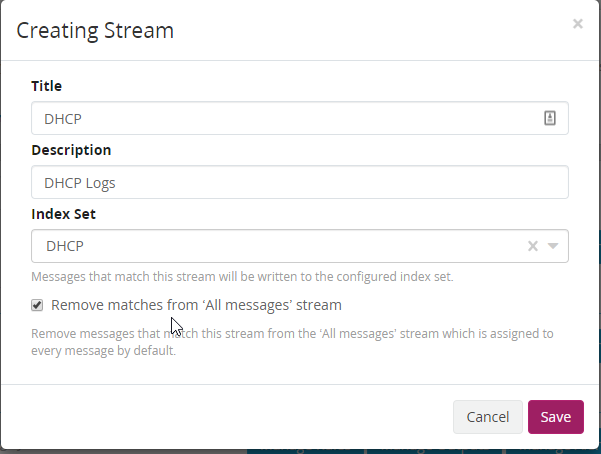
With the indexes created data needs to be routed into these indexes. To do this browse over to Streams. Select “Create Stream” and build a stream for a DHCP logs. Remove logs that are moved to the new index from the default index. This will help prevent duplicate messages and keep our default index clean.
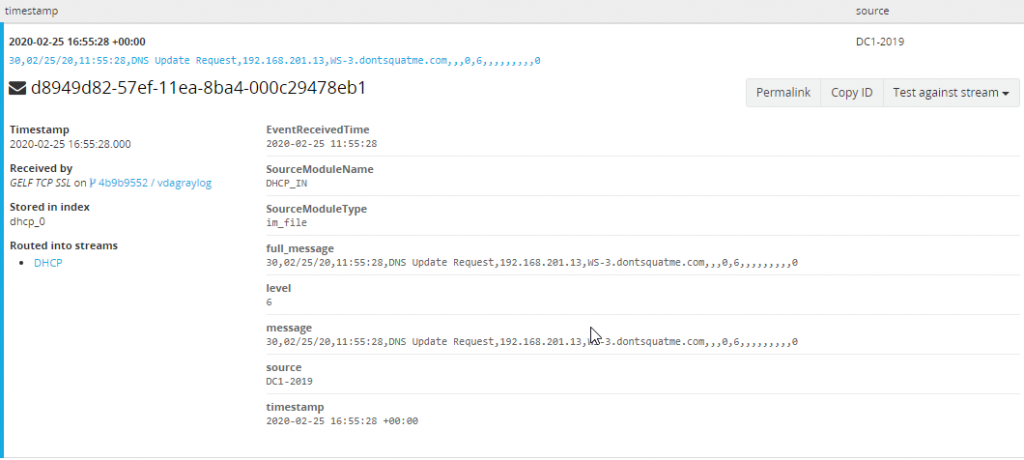
With the stream created, rules need to be added to help Graylog know what messages route into this index. To do this find a DHCP message that we can use as a template. Open Search and search “DHCP_IN”, using this as this is the module name reported by NXLog to Graylog allowing us to only show data from the DHCP_IN input. Expand one of the DHCP logs gathered and select “Copy ID” also take note of the index this log is stored in.
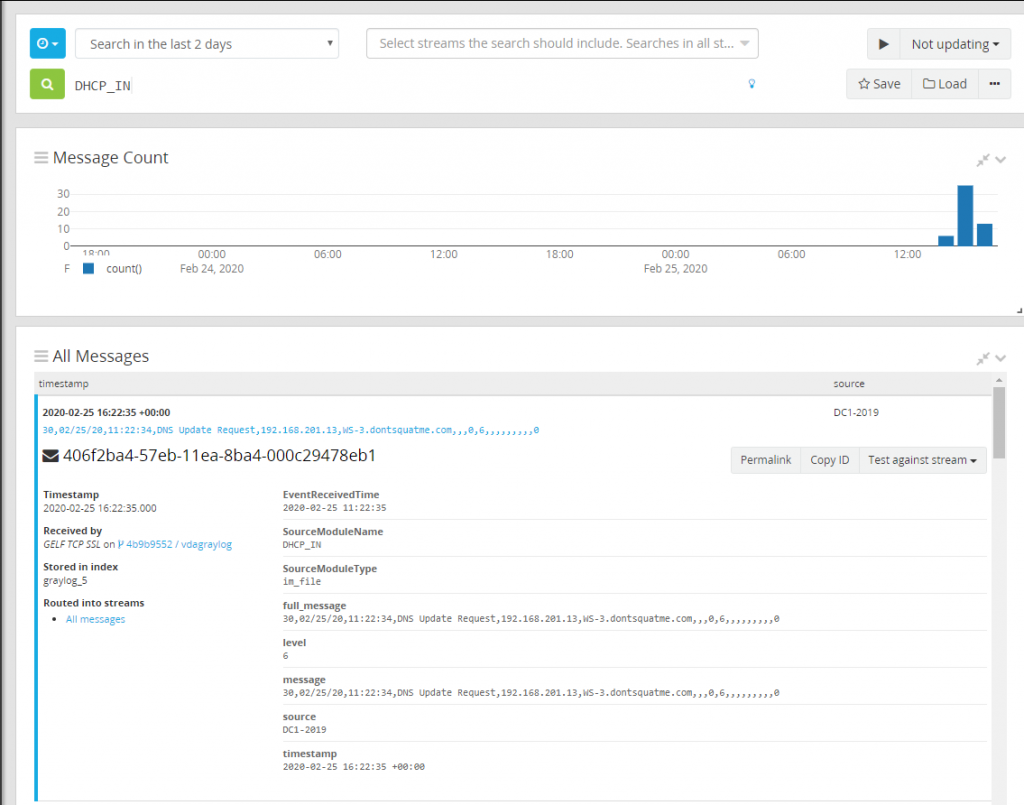
With the copied ID and index head back to the Stream interface. Select “Manage Rules” on the DHCP index that was created. Inside of this section select the tab “Message ID” and paste the copied message ID and input the index this message is part of. With the message now loaded fields available to work with will become visible.
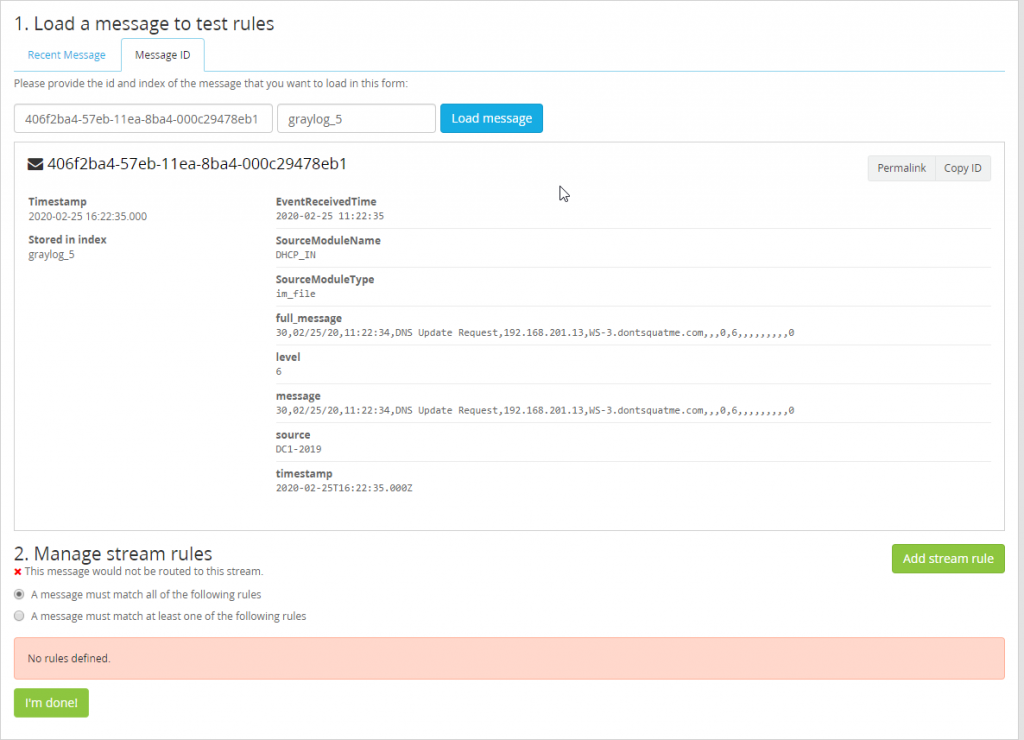
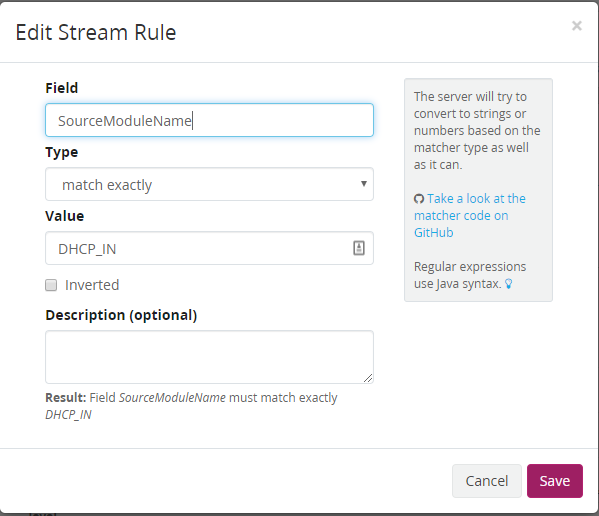
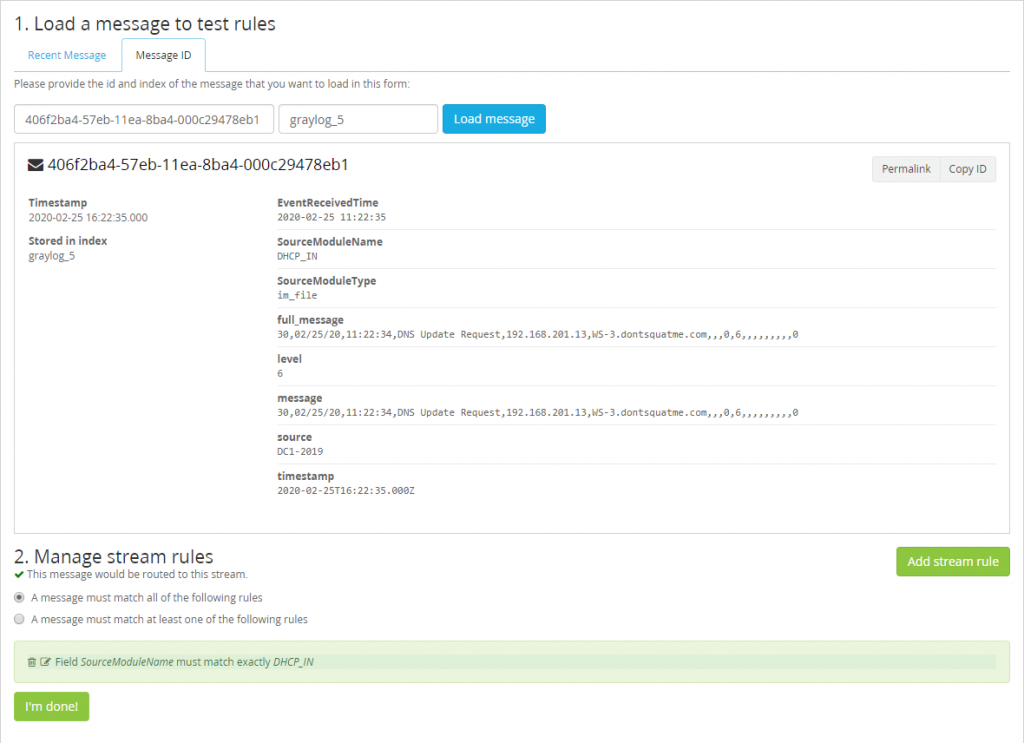
With the message loaded, lets add the stream rule to help route these messages. For this use the field “SourceModuleName” which is reported to Graylog from NXLog. Match the value DHCP_IN so that all messages with the Source Module of DHCP_IN get added to the DHCP Index.
If successful you should start that our field rule matches the message loaded.
Start the stream now that it is configured it and data should flow into the DHCP index.
Complete the same steps for Event Logs but use a “SourceModuleName” of “EventLog_In”. After completion there should be a total of five streams.
Cleaning Up Our DHCP Logs
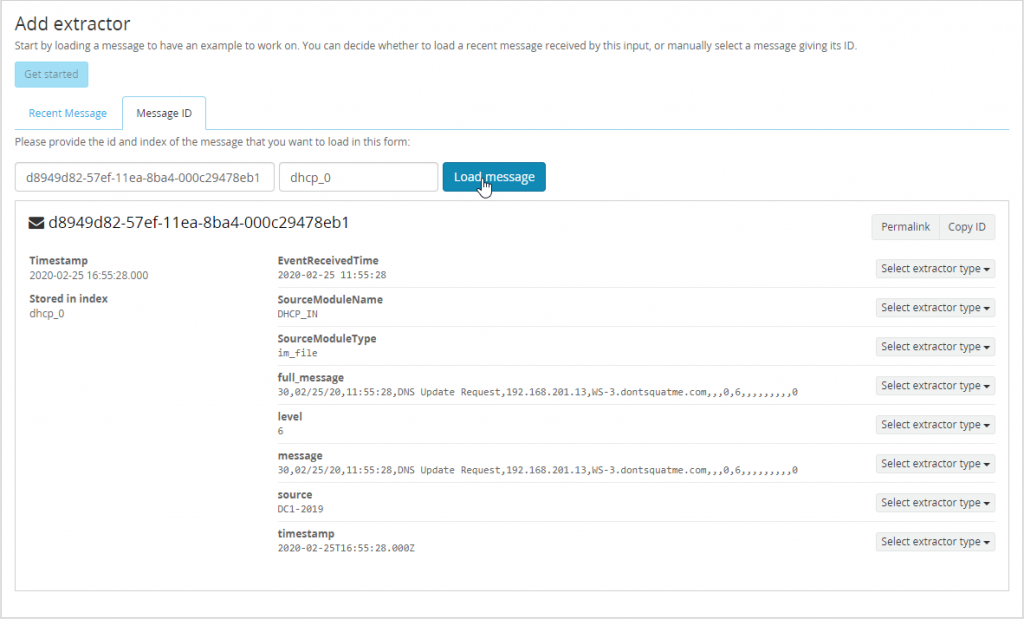
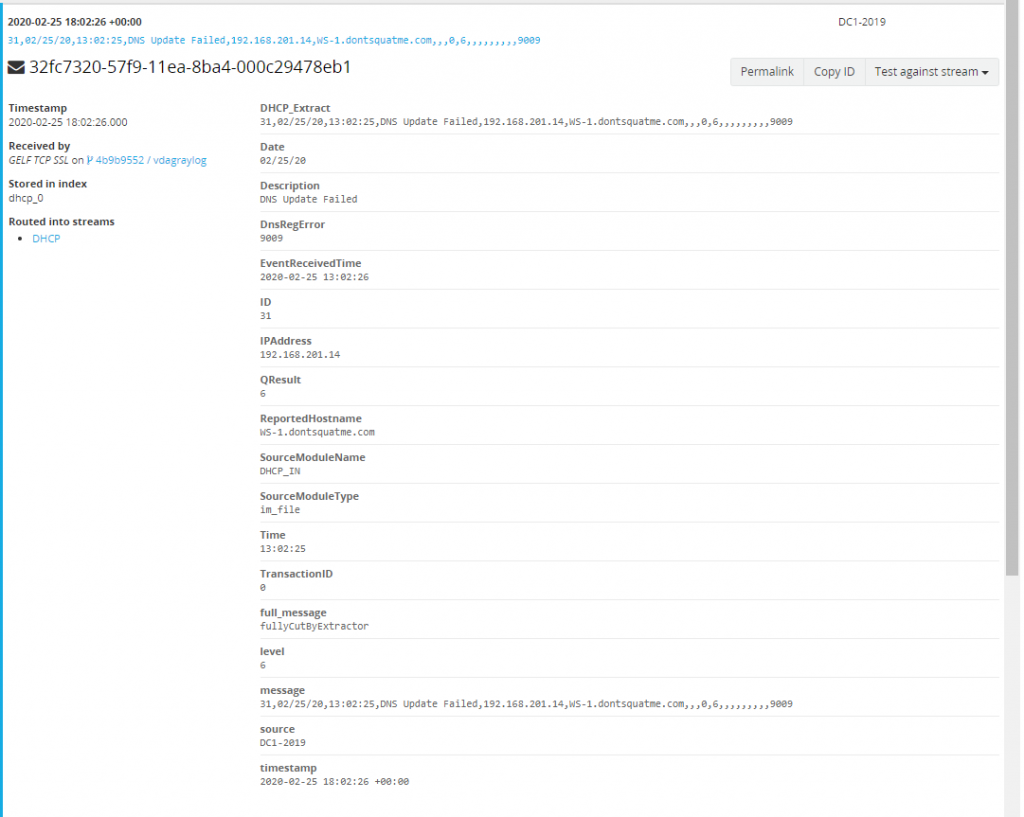
Now that logs are in their correct index lets work on cleaning up the logs we are receiving from the DHCP server. Right now the logs are coming over as one large string making searching for individual terms more difficult. Instead break each each field in the CSV document into their own Elasticsearch field. To do this head over to “System/Inputs” and manage the extractors of our GELF TCP SSL input that was created earlier. Select “Get started” and load up a DHCP message to evaluate.
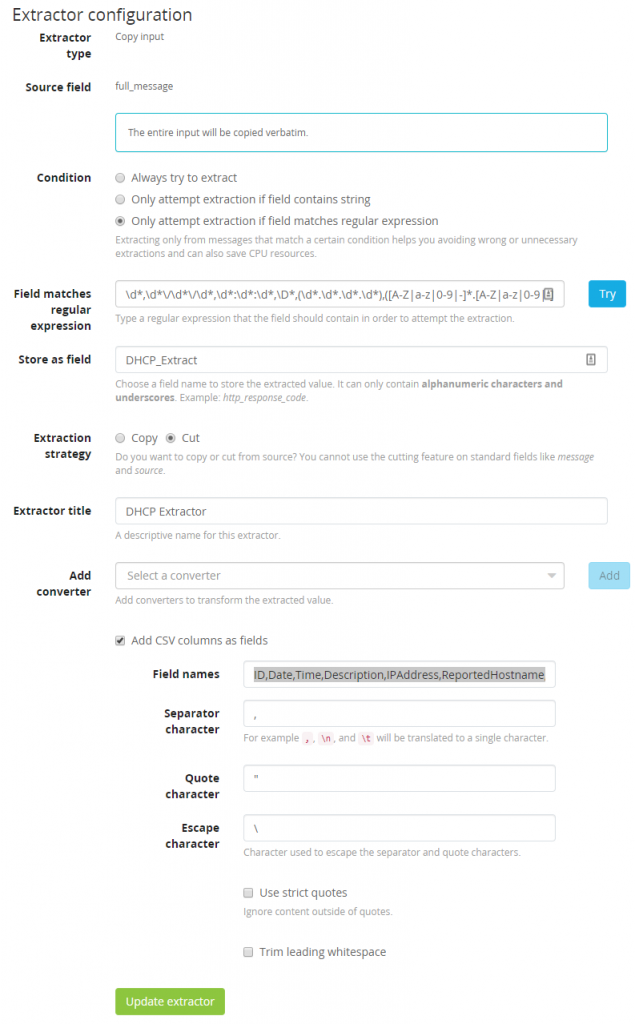
With the message loaded lets select a extractor type of “Copy Input” on the field “full_message”. Make sure to add a regular expression that will only attempt to extract if a message matches the requirements. This ensures Graylog doesn’t process every message through every extractor. Use the following Regex to only extract our DHCP data.
\d*,\d*\/\d*\/\d*,\d*:\d*:\d*,\D*,(\d*.\d*.\d*.\d*),([A-Z|a-z|0-9|-]*.[A-Z|a-z|0-9|-]*.[A-Z|a-z|0-9|-]*),[A-Z|a-z|0-9|-]*,[A-Z|a-z|0-9|-]*,[A-Z|a-z|0-9|-]*,[A-Z|a-z|0-9|-]*,[A-Z|a-z|0-9|-]*,[A-Z|a-z|0-9|-]*,[A-Z|a-z|0-9|-]*,[A-Z|a-z|0-9|-]*,[A-Z|a-z|0-9|-| |.]*,[A-Z|a-z|0-9|-]*,[A-Z|a-z|0-9|-]*,[A-Z|a-z|0-9|-]*,[A-Z|a-z|0-9|-]*
Store this as the field “DHCP_Extract” and cut the message being modified so a second copy of the data is not made. Next add our converter, the converter type will be “CSV to Fields” and will use the following fields as described in the extension ParseDHCP but make sure to remove all spaces and leading “$”.
ID,Date,Time,Description,IPAddress,ReportedHostname,MACAddress,UserName,TransactionID,QResult,Probationtime,CorrelationID,Dhcid,VendorClass(Hex),VendorClass(ASCII),UserClass(Hex),UserClass(ASCII),RelayAgentInformation,DnsRegError
If everything is configured properly the new extractor should look like the following image.
If everything is successful next time a DHCP log is viewed individual fields we can search and alert on are being created for each message.
Using the Data We Have Created
Now that data is flowing into the system the data can be used to help relay information quickly to users. In this section we will describe how to create dashboards and our first alerts.
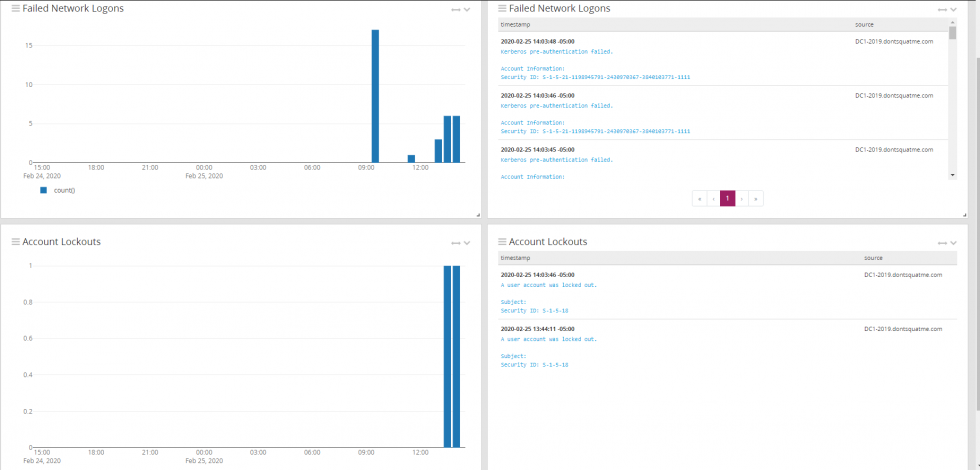
Creating Our First Dashboard Widgets
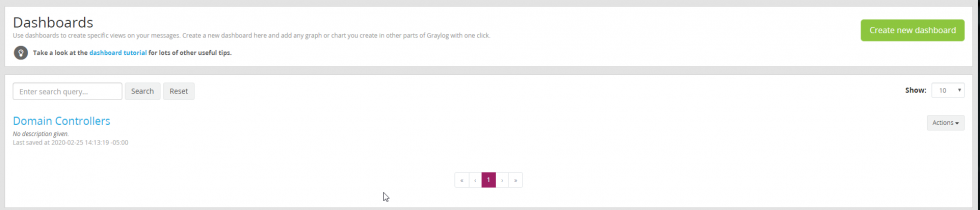
With the data in our system lets create two new dashboard widget. One widget for accounts that have been locked out and one widget for failed network logons. Start by making a blank dashboard to modify. To do this select “Dashboards” at the top and then select “Create New Dashboard”. Create a dashboard called “Domain Contollers”.
Return to our primary search page and search for EventID:4740 OR EventID:4771. After execution search use the drop down on them message count to select “Copy To Dashboard” and select the Domain Controller dashboard created earlier.

Edit the widget just created to only show failed logons, this can be done by using the search term EventID:4771. Select “Save” and we have created our first widget.

On the left side of the screen expand the menu and select “Aggregation”.

With the new menu open, fill in the search field with EventID:4740. Also select the metric of count() and a row of timestamp. Select save and now two widgets should be visible. One showing a 24 hour bar graph of account lockouts and another showing a 24 hour bar graph of failed logons.

The same process can be repeated for two message tables that will also show the pertinent logs from our search queries. In the end there should domain controller page with 4 widgets.
Related Posts

4 Benefits of SIEM Software
Why SIEM Software is Essential for Your Business At VDA Labs, we pride ourselves on…

MSSP Services for Your Organization?
In today’s digital age, businesses face increasing threats from cyberattacks, data breaches, and other security…

How SIEM Helps Safeguard Your Business
VDA Vigilance SIEM Solution stands at the forefront of cybersecurity, offering unparalleled services in monitoring,…

4 Security Breaches SIEM Can Help Mitigate
Security Information and Event Management (SIEM) is a crucial component in the modern cybersecurity arsenal.…

What Is SIEM Software and How Does It Work?
Overview of Security Information and Event Management (SIEM) When it comes to information security, one…

Citrix ADC (Netscaler ADC) Multi-Factor Bypass
While working with a client, VDA engineers encountered an interesting circumstance that allowed for the…